hello friends .. I'm posting the indicator index didi, Didi of Brazilian Aguiar, in which the signals of purchase and sale are with the crossing of moving averages (blue and red), where the purchase occurs when the average red and blue cross sale, when the average red crosses the blue. This indicator consists of the difference of three averages, 3, 8 and 20. I would like somebody's help to edit the bookmark and insert an alarm occurs when crossings averages. Can anyone help? {file}
Ignored
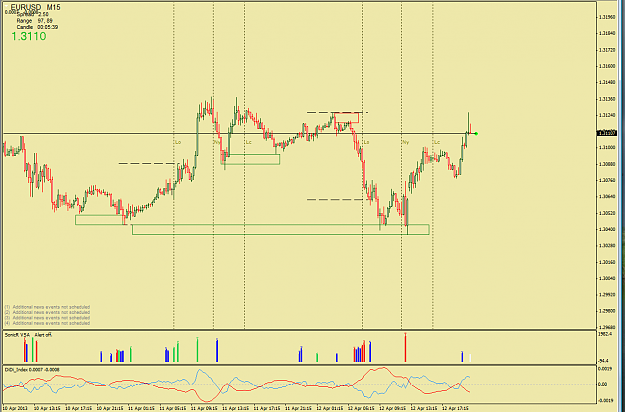
I think you and others would have more value in knowing how price moves and espically around s+r areas.
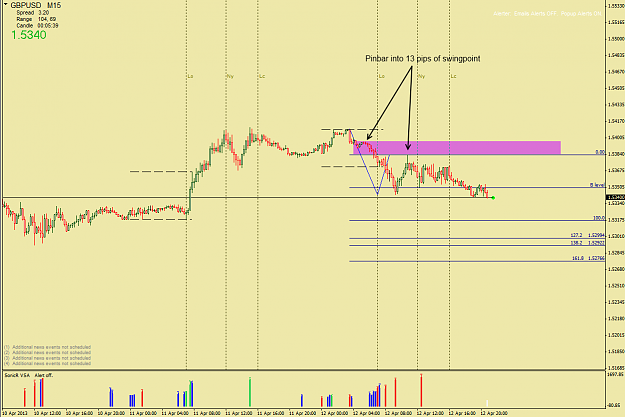
For Eur/Usd it´s 7 pips and for Gbp/Usd it´s 13 pips.
'
Drop the indi´s - they will only confuse your mind...
hello friends .. I'm posting the indicator index didi, Didi of Brazilian Aguiar, in which the signals of purchase and sale are with the crossing of moving averages (blue and red), where the purchase occurs when the average red and blue cross sale, when the average red crosses the blue. This indicator consists of the difference of three averages, 3, 8 and 20. I would like somebody's help to edit the bookmark and insert an alarm occurs when crossings averages. Can anyone help?
This indicator can be used with the system sonicr!!!
Joined Mar 2008
|
Status: PVSRA with Traderathome
|23,250 Posts
Put Your Money Where Your Mouth Is!
There is nothing special about any moving average line, regardless of number (1 thru any number) and regardless of method (sma, ema, etc.). When you have been at this for years you know sometimes one thing looks supreme, another time something else looks supreme. Nothing is supreme.
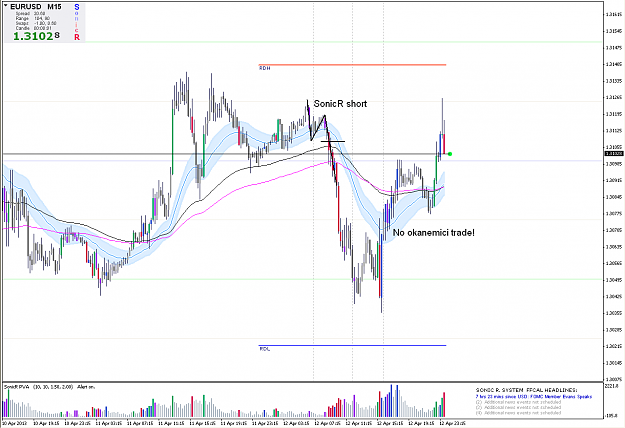
Attached is an example using EU in which okanemici's H1 34ema line is magenta. I have drawn a Sonic R. System valid waveform with EP. Okanemici's prostituted method turned out not so good. There is no trade. There are other pairs where okanemici's method did provide a trade on Friday, but only after the Sonic R. System did, and for less pips than the Sonic R. System (AU short, GU short). There might be even more examples of okanemici's method coming after and yielding less, but I stopped after the first three out of three pairs that I looked at!
The Sonic R. System is elegantly simple and effective. For better results don't add indicators. Add more patience in trading and more discipline in following the system.
Everyone is free to trade as they wish, but if they are not trading the Sonic R. System Classic or Scout trades, they should move on to another thread.
Okanemici has called me wrong on a couple of my trades, which are still running. The outcome has yet to be, so let us all wait and see. Meanwhile, by postings on this thread I made 1,126 pips this week and 1,289 pips the week before. Okanemici has posted no trades, zero pips!
hello friends .. I'm posting the indicator index didi, Didi of Brazilian Aguiar, in which the signals of purchase and sale are with the crossing of moving averages (blue and red), where the purchase occurs when the average red and blue cross sale, when the average red crosses the blue. This indicator consists of the difference of three averages, 3, 8 and 20. I would like somebody's help to edit the bookmark and insert an alarm occurs when crossings averages. Can anyone help? This indicator can be used with the system sonicr!!! {file} {file}
Ignored
Sonic R. or Sail Away!
Sonicers, the Sonic R. System is set. If you feel you need more, or different indicators, then you are clearly not commited to the Sonic R. System which charges you with the responsibility to learn how price moves and the significance of certain price movements around significant S&R. Maybe you are not having the success you believe you should be having. If so, maybe that is because you have taken seriously this responsibility, but not given youself enough time to grow better at it. Maybe it is because you are a poor student, have refused this responsibility, and all the study and practice involved, and just want a bunch of different indicators to show you how easy it is to make money in this market.
If you are the former, keep at it. Read more and re-read more, and practice doing the right things. The Sonic R. System is elegantly simple and effective. If you are not effective with it, it is you, not the Sonic R. System. For some folks progress moves quickly. For others it doesn't. I have been at this thread several years and only now am I feeling more confident in myself.
If you are the latter, then hop aboard your boat and sail away.
TAH could you please share the PVA volume indicator? As I only have VSA from template. And if you could provide small instruction on how to use it. Regards, msis125125
Also any chance you can upload your volume indicator and small explanation about it?
Ignored
Brokers Don't All Close at the Same Time on Fridays & Don't Ask Questions Until You Have Read Every Post!
Some brokers close on Friday an hour before Alpari closes. Those brokers won't show the drive down. On the other hand, the drive down might only have been in Alpari's world (they and their clients), which theoretically could happen since we are talking about the last minute in the week. Nobody else, with any other broker, might have traded in that last minute.
BTW, you continuously ask about the PVA indicator. I have already answered you, and others too! I'm tired of responding to the same question being asked over and over by folks too lazy to read previous post containing the answers. As far as how to use PVA (or current VSA), my posts provide lessons. Go back and read them. I'll bet you haven't even read the User Notes for the indicators! Which likely means you haven't even read the instructions in the releasing post of the indicators!
A dedicated Sonicer catches up on all posts not yet read. Lazy, undedicated "whatevers" won't put in the effort to do this. Why should I, or anyone else, put in the effort to repeat answers? A college text book doesn't, and I don't think anyone here should, either.
Sonicers, tell 'ya what! You ask a question I have already answered and I will ask you to send me $50. When I receive the $50, I will repeat myself just for you! Deal?
Hi Tah, I have a request for you regarding the PVA indi. Could you include the option of showing volume on another chart, ie 1 min volume on a 15 min chart etc. ? Thanks H.
Ignored
Analyzing the M1 Chart is Essential to a Proper PVA (or Current SonicR VSA)
I'm not sure what you mean. It isn't possible to show 15 slender 1 minute volume bars beneath a single M15 Candle! Really, Hansma, just switch to the M1 chart and study what is there, regardless of exactly where each 15 minute TF starts and stops relative to the individual minute bars. It doesn't matter!
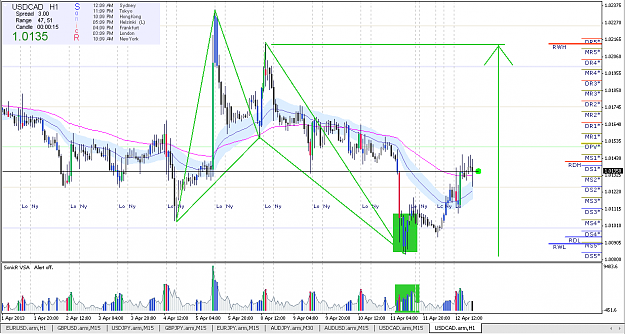
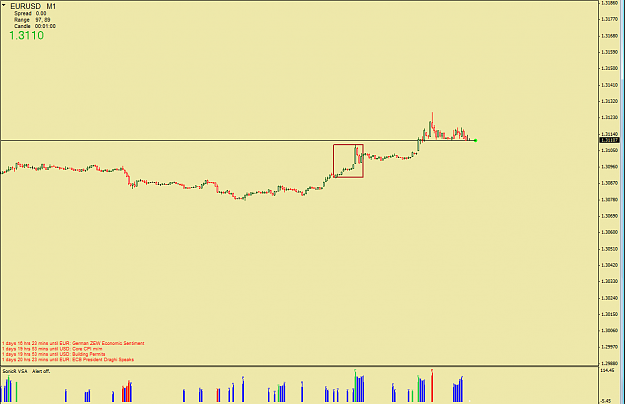
It may gap down in Monday open.. The candle of next week will be THE important one.. Sonic {image}
Ignored
Gold Losing Glitter
Told cha!
However, with a run down like this and terminating in high volume at the M1 lows just before the close Friday, one might well wonder if the next move will be a pullback. Why? The price manipulators (GoldmanSachs, JPMorganChase, other banks, etc.) are at some point going to want to take profit on shorts entered at really high prices, and then push the price back up to re-load with new shorts.
The Super Trade!
Here is my theory I only expressed before privately.
Crete is the first example in modern time of a country implementing a form of currency devaluation; repatriating money from the more wealthy. When countries over spend and under employ to the point where the production of new wealth (mining, manufacturing and farming) is insufficient to even pay the interest on the country's debt, there are only two known solutions: start a war and take the wealth of another country, or devalue currency to devalue the interest on the debt to where the production of new wealth is sufficient to cover the interest on the debt.
So, if the world gets to that point, which of the two choices do you think will be first tried?
Let's digress briefly. Getting to that point could be avoided if the disparity between the rich and the poor, which has accelerated in recent years, could be pushed back, if the goobs of money being hoarded by the super-rich could be repatriated to the coffers of the countries. A super tax on the super rich is needed because they are the only ones with enough money to fix the problem. Printing more money just pushes us all closer to the edge. Unfortunately the super-rich control the banks, the politicians and the laws governing bank regulations. They are the ones that created the global crisis. They are the ones that got bailed out. They are the last ones willing to do the honorable thing to correct the problem they created! Unless the super-rich are all rounded up and forced to repatriate goobs of their wealth, and especially if we continue to print money, we will get to the point of having to devalue currency. Ok, now back to the subject.
So, what is The Super Trade?
The price manipulators of precious metals (gold, silver, etc.) start shorting heavily. Next they start moving the price lower, relentlessly while their "talking heads" proclaim more declines coming. And more declines come, with the price manipulators helping the price lower whenever it falters. Now this won't be a short process like the YEN Sting will be. This will be a much longer process, maybe at least a few years. As the price drops, holders will give up and sell. Of course as the price drops and continues to do so, as more and more folks sell, somebody has to be buying. Who do you think are the buyers? Right! The price manipulators, such as GoldmanSachs, JPMorganChase, probably the central banks too. So, where does this all end up going? The bottom line is this. Let us suppose eventually the nations of the world have to face currency devaluation. Then let us suppose they don't.
Once countries start collapsing, devaluing their currency, the price manipulators will have their "talking heads" spreading panic and that the best solution is to buy,.......you guessed it! Gold, silver, etc. will be talked up! The price manipulators will have by this time cornered the market, because they have been the primary buyers in their scheme to drive prices down and get everyone else to sell. Now, they will start talking up precious metals, and driving up their prices. It won't take much of either, with fear spreading about currency devaluation more and more people will trade paper (fiat money, maybe soon to be worthless) into precious metals. Practically overnight, relatively speaking, the holders of precious metals, the price manipulators, will see an incredible increase in the value of what they own. And they will drive the price up, just as they drove the price down. They will make fortunes upon fortunes!
What if currency devaluation never comes? The price manipulators will just do what they are doing with the YEN. First they shorted it. Then they started talking about the necessity for the YEN to be devalued. Then they drove the price down, down, down, down. As more folks sold, the price manipulators kept buying. Now they own a good portion ot the country's coin. Now they need to reverse price and make their fortunes. So, what happens? Yep, one of the big "talking heads" (of BOJ no less) starts saying the YEN has been devalued enough. In a day or so, another "talking head" (other side of the world) proclaims "currency war!, the YEN needs to be increased in value". Understand, all these super-rich folks and their banks and their talking heads are in league. They are not actually in opposition. It is just that now is the time for the STING. Now is the time, since the super-rich own a lot of YEN, to drive up the price! They will make fortunes upon fortunes!
So, if there is no currency devaluation in the future, the super-rich that corner the market on precious metals in the meantime will just do the same as the are starting to do with the YEN: first talk it up, then drive it up, and as more and more people also switch and start buying again, the super-rich will eventually make fortunes upon fortunes. Sound familiar? You see, they don't actually need the crisis of countries devaluing currencies to make this scheme work, but if that were to happen then the fortunes the super-rich make will be bigger and will come faster.
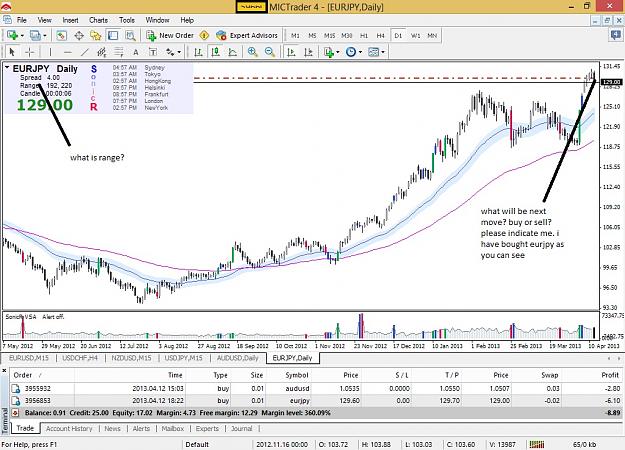
Hello Sonic Sir, how are you? i hope you doing well. i am using your trading system and i have improved my earnings through it. now i have a confusion about this situation please tell me what will happen next? i have attached picture of eurjpy daily chart. please tell me {image}
Ignored
Tell Me the Future & No, I Have Not Followed Instructions and Read All That I Was Told To Read!
xetrader,
You will probably hear from Master Sonicdeejay, if for no other reason than your request is outrageous! It is so outrageous, I have to put in my own two cents worth. So, here it goes.
We are not a signals service. We don't sell anything. We only try to help other honest and serious traders via the Sonic R. System, the free indicators and templates we provide, and the ongoing posting of trades and commentary. Every trader is responsible to do their own due diligence analysis and is responsible for their own trading decisions. You are asking that we tell you the future! Get real! We don't know the future. What makes you think we, or anyone else knows the future? I have never in all my born days heard such a ridiculous request!
So far as "confusion" goes, it happens, but you should probably research for reading material on the psycology of markets. I've never read anything on it, so I have no references for you. I have picked up my knowledge from years of being at this. The MMs are not noted for adherence to predictable price action. Next week, we will all see what happens.
Finally, I can see on your chart that you are asking "...what is range?", referring to label in the Control Panel. If you had followed the instructions in the releasing post for the indicators, you would have read everything you were supposed to read, and you would know. I refuse to bow anymore to such flagrant lazyness by repeating all over again, just for you, what I have taken great pains to explain already. Go do your homework. Go back and read!
Sonic R. System VSA First off, our VSA is not exactly like the "original" VSA. Our VSA is a more simple combination of coloring of the volume histogram using blue bars to indicate volume rising above the 10 period average volume by 38% or more, and using green and red bars to show "institutional activity of note" when bull or bear candles have the highest product of spread X volume over the past 20 bars. The blue bars are simply an indication "business is picking up". The green/red bars denote "institutional trading" went into high...
Ignored
So, let's take the key points.
We have 4 possible colors in our PVA/VSA indicator provided by tah:
Grey: Normal candles Blue: "Business is picking up" candle. A candle telling us that volume is rising above the 10 period
average volume by 38% or more. It can be interpreted in so many ways, but the candle is telling us "Yo!Pay attention" Green: Bull candle denoting high buy activity Pink: Bear candle denoting high sell activity
Easy, right? No, it's not that simple. The volume has to be contextualized every single time. We have to take into account if the volume is rising or decreasing around that key candles, if they are in an important level (S/R, trend line, double/triple zeros, etc). Every single piece of information that we can get around these key candles will help us to contextualize them.
I guess you are wondering now how can you do that, and the answer is quite easy: reading tah's analysis about volume (those posts starting with "x/x, bull or bears?" and practicing. I´m not an expert at all, I'm totally new with this system but I'm in love with it because it's simple. But at the same time, if you study it a lot, you can win a lot of edge in your trades. I started to study this system only 3 weeks ago, it's nothing. But I know that if I study and pay attention, I can become a good trader, and you can do the same.
I understand tah's frustration because 90% of the questions are already answered. I´m sure tah has no problem at all to answer questions about the system, but those questions must prove that you read the first post and u are studying it hard. But u can't do is what okanemici did a couple of pages ago, saying tah's trade is "gambling and a suicide" only cause you don't understand it. Of course u can have doubts and no confidence in those trades because they are not a "normal" trade following the trend, but you can't say it's gambling. I had doubts when he started shorting yen pairs and I said it, and he wrote a post with an argument and i wait. He was right and I learnt a really important lesson.
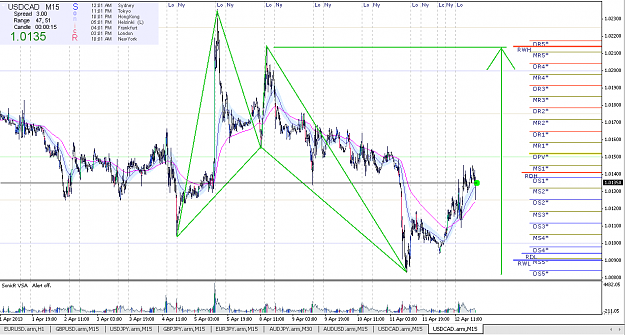
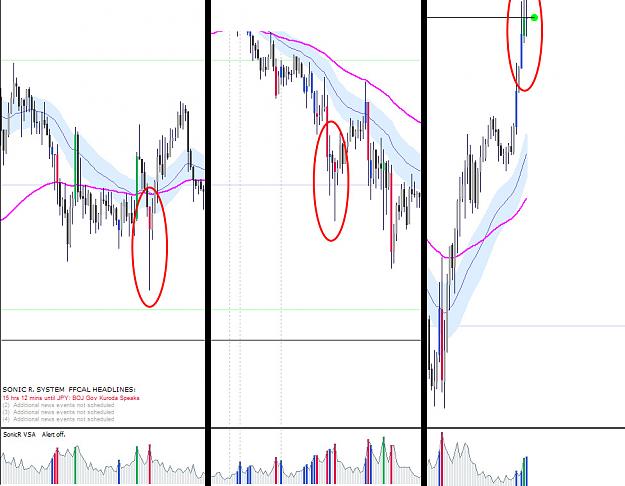
I attach you an image with 3 examples where you can see the same type of candle. A green or pink candle with big rejection. I'm having troubles when I try to catch the message or when I try to contextualize those type of candles. I'm not sure what type of information they are giving me and I want to ask you for a tip regarding that.
Those candles normally mean high sell/buy activity, but they have a big rejection. Are they mean a possible reversal because the found big supply/demand? Are they a first "tip" or "attempt" to drive the price in one direction? Of course I guess the meaning of the candle will be different in each situation, specially if we pay attention to the volume around them. But I would appreciate an advice regarding those candles.
Happy sunday!
PS: Sorry if I make typos, english is not my native language.
Sonic R. or Sail Away! Sonicers, the Sonic R. System is set. If you feel you need more, or different indicators, then you are clearly not commited to the Sonic R. System which charges you with the responsibility to learn how price moves and the significance of certain price movements around significant S&R. Maybe you are not having the success you believe you should be having. If so, maybe that is because you have taken seriously this responsibility, but not given youself enough time to grow better at it. Maybe it is because you are a poor student,...
Ignored
Yes -tah, you are absolutely right! There are lot of more threads with different indicators and so on. I'm a beginner and some graphs with different indicators are so messed that is no way to understand of it. And this thread is not meant for posting a messed up graphs.
And you "okanemici" just came to contest everything what -tah have been teaching here. Besides, you are wrong about Ucad.
-tah's Ucad long was right, even if "okanemici" didn't understand that, there was a big and beautiful bullish butterfly to confirm that long move too.
Gold Losing Glitter Told cha! However, with a run down like this and terminating in high volume at the M1 lows just before the close Friday, one might well wonder if the next move will be a pullback. Why? The price manipulators (GoldmanSachs, JPMorganChase, other banks, etc.) are at some point going to want to take profit on shorts entered at really high prices, and then push the price back up to re-load with new shorts. The Super Trade! Here is my theory I only expressed before privately. Crete is the first example in modern time of a country implementing...
Ignored
Take the time to study Ichimoku and see where possible supports.
Brokers Don't All Close at the Same Time on Fridays & Don't Ask Questions Until You Have Read Every Post! Some brokers close on Friday an hour before Alpari closes. Those brokers won't show the drive down. On the other hand, the drive down might only have been in Alpari's world (they and their clients), which theoretically could happen since we are talking about the last minute in the week. Nobody else, with any other broker, might have traded in that last minute. BTW, you continuously ask about the PVA indicator. I have already answered you, and...
Now, I have a question for TAH/sonic. I attach you an image with 3 examples where you can see the same type of candle. A green or pink candle with big rejection. I'm having troubles when I try to catch the message or when I try to contextualize those type of candles. I'm not sure what type of information they are giving me and I want to ask you for a tip regarding that. Those candles normally mean high sell/buy activity, but they have a big rejection. Are they mean a possible reversal because the found big supply/demand? Are they a first "tip"...
Ignored
Tall Green/Red "Rejection" Candles, MMs Bulls or Bears? M1 PVA (or currently VSA) Sheds Light!
Tymedu,
First, I thank you for jumping in and taking some of the workload imposed upon us by others. That is real Sonicer Spirit you demonstrate. Perhaps more will do the same, though I'd be thankful just if more read more and asked less.
As to your question concerning "big rejection candles", I think I see the fine point you might be missing because you stated previously that green candles are buying and red candles are selling. That is not necessarily the case. Consider this. Suppose price is coming to what we will later discover as a notable high, a high where we later discover the MMs must have planned as the area to close their longs and/or open shorts. Suppose the chart shows a dramatic green rejection candle first striking that area of new highs. Was that "big rejection candle" buying simply because it is green? When I see something like that the first thing I do is examine that area of time on the M1 chart. I want to know exactly how the volume was distributed relative to the increasing price during the time frame of that big green rejection candle. It may turn out that there was less volume during the initial time when the price was starting up, and a lot more volume in the ending time when the price was from half way up to the top. If that turns out to be the case, then immediately the suspicion occurs that because the MMs saved most of their trading until the price got higher, the volume was not really the volume instigated by buyers (other than to push up the price), it is more likely it is volume instigated by sellers and that premise being born out by the fact that most of the volume during the TF occurred at the higher, not lower prices.
Of course, just the opposite sort of analysis needs be done on big red rejection candles, because most of the volume might be found to exist at the lower prices when viewing the M1 chart, and if so then it was a move down instigated by bull MMs seeking lower prices to close shorts and/or start loading up on longs.
The color of candles is based on if the close is higher than the open (green) or lower than the open (red), typically called "bull" and "bear" candles respectively. But this "terminology", while descriptive in one way can be grossly misleading when it comes to divining if the MMs are bulls or bears. Bull MMs frequently put on bear price moves! So a "bear" candle that leaves the price lower than before might actually be the result of bull MMs at work. A "bull" candle that leaves the price higher than before might actually be the result of bear MMs at work!
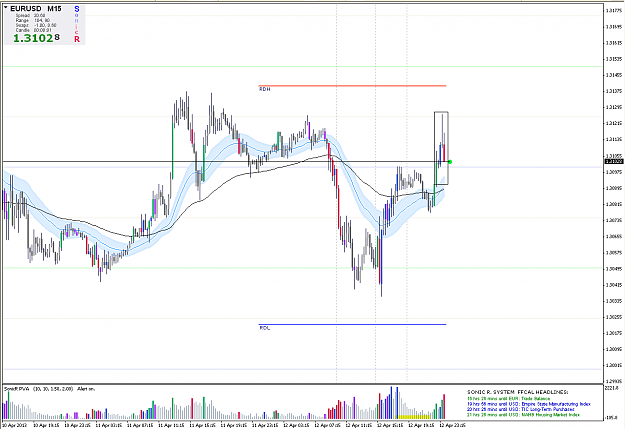
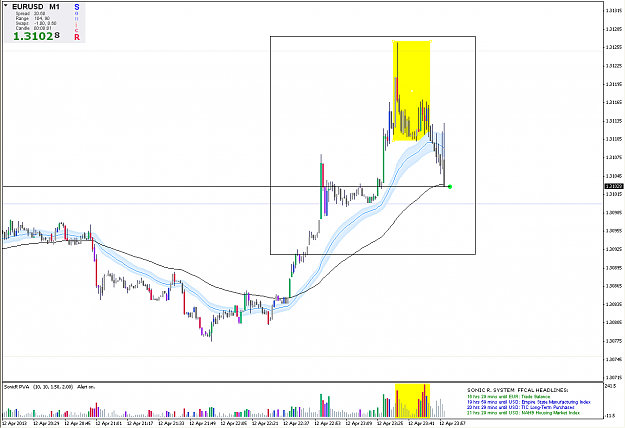
No price volume analysis is complete, or even competant, if it does not include a careful examination of the M1 chart to see the price levels where the bulk of the trading is taking place during notable trading activity. The two attached pics. demonstrate. First, on the M15 chart, the big green rejection candle pushes price back to highs (above the whole numbe = clue), followed by more candles pushing price further up. Are the MMs bulls or bears? That first green candle might suggest the MMs are bulls, but look at the M1 chart. It clearly shows that once the MMs got the price above the whole number, trading levels were highest and with some of the highest trading levels being at the much higher prices! Clearly then, the MMs are closing longs and/or opening shorts. They are bears. Including an analysis of the M1 chart increases the odds that we will be able to properly determine if the MMs are bulls or bears.
Finally, keep this very important point in mind. Moves up like this one demonstrated can be followed by more moves up, in what eventually turns out to be a series of pumps as bear MMs continue to sucker in longs and continue to take the short side of those long trades, all the while thusly building a big short position. The point is, we can more easily determine if the MMs are bulls or bears than we can determine when they are going to start moving price to make their profits! Seeing where notable action takes place relative to S&R helps, but sometimes when price might be moved above a whole number (where MMs like to build shorts) we can think the MMs are bears and the top is in, but find out three days later the MMs, in a series of pumps, now have the price again above a whole number, just a whole number several levels higher than what we first thought was the top! This is why it is as important to note where price started from as it is to see where it lands. If the price started only 100+ pips below a day or so ago, chances are it is not finished moving up. On the other hand, if price started 200+, or 250+, etc. pips lower a number of days ago and is now landing above a half or a whole number, and on very high trading up there, the chances are a reversal top is under construction.
There is no Holy Grail in trading, but this method of price volume analysis is as close to one as I have ever seen.
Right I am back in the forum research, well 1000 pages should take me few weeks or months even to read. I wanted to ask sonic or TAH what do you think about Better Volume indicator or delta volume?
Are they worth looking into?
The reason I ask is that because I am very disappointed in all indicators, nothing but price action and Elliot wave (sonic setup) seems to be working for me, so I was wondering would any of you be so kind to point me in the right direction for the most efficient volume indicator?
Tall Green/Red "Rejection" Candles, MMs Bulls or Bears? M1 PVA (or currently VSA) Sheds Light! Tymedu, First, I thank you for jumping in and taking some of the workload imposed upon us by others. That is real Sonicer Spirit you demonstrate. Perhaps more will do the same, though I'd be thankful just if more read more and asked less. As to your question concerning "big rejection candles", I think I see the fine point you might be missing because you stated previously that green candles are buying and red candles are selling. That is not necessarily...
Ignored
Thank you again for exellent explanation professor.
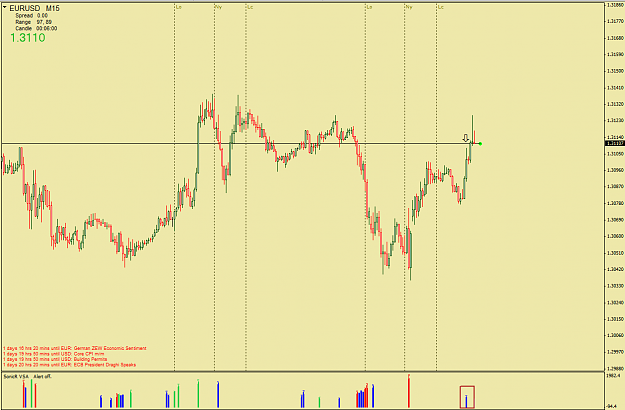
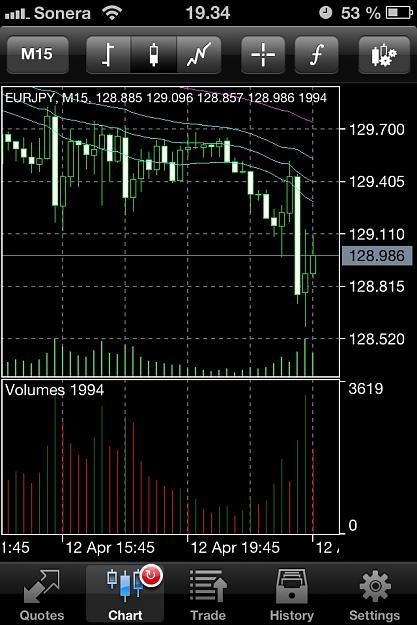
But again, this brings in my mind the discussion about EJ we had on friday. Still now, when I look back those friday charts, I'm seeing high activity on lows. Wasn't that supposed to indicate MM buying? I'm seeing activity being on EJ to be opposite to EU and GU that I see to be bearish activity.
And forgive me to use three posts on this subject now, but I only can post one picture per post with iPhone.
Thank you again for exellent explanation professor. But again, this brings in my mind the discussion about EJ we had on friday. Still now, when I look back those friday charts, I'm seeing high activity on lows. Wasn't that supposed to indicate MM buying? I'm seeing activity being on EJ to be opposite to EU and GU that I see to be bearish activity. And forgive me to use three posts on this subject now, but I only can post one picture per post with iPhone. Here high volumes on 15min EJ {image}
Ignored
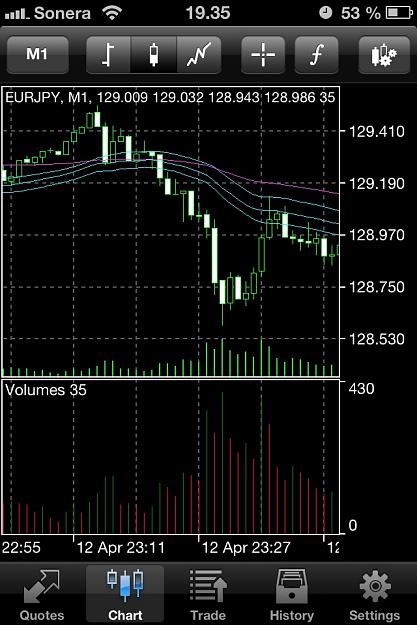
Here 1min chart showing high volumes on lows when price is going down.
Thank you again for exellent explanation professor. But again, this brings in my mind the discussion about EJ we had on friday. Still now, when I look back those friday charts, I'm seeing high activity on lows. Wasn't that supposed to indicate MM buying? I'm seeing activity being on EJ to be opposite to EU and GU that I see to be bearish activity. And forgive me to use three posts on this subject now, but I only can post one picture per post with iPhone. Here high volumes on 15min EJ {image}
Ignored
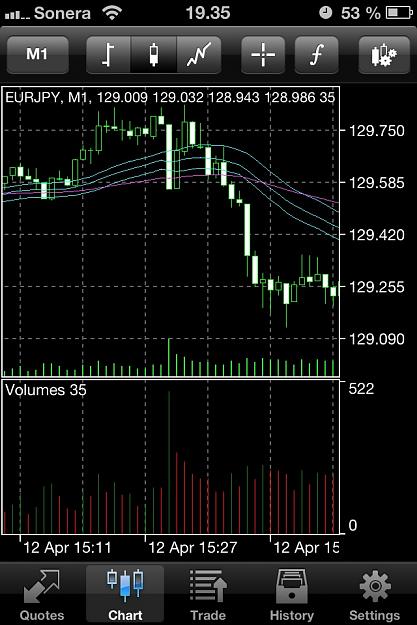
And same high volumes earlier at lows when price is going down.