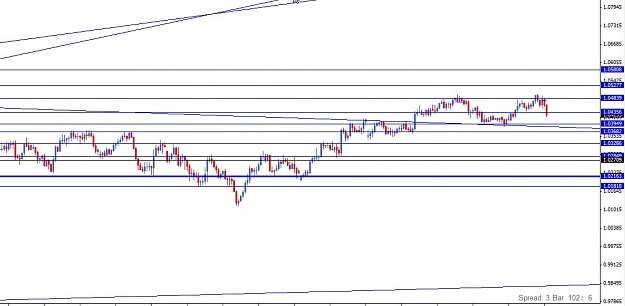
Dislikedthis is my chart i knew it can be happend just yesterday.. so i am gonna put short selling at 1.048 while my long buy is still on the way at 1.04 .. nice isn't? technical: it might be support 1.043 or 1.041/40 {image}Ignored
i am sure everyone who those fancy to candlestick charting is one eye with me...it is look like this
circle : small bullish engulfing pattern
now act as support.. but if break then it would break the 1.043 my abc elliottwave pattern and through below it (>1.041) before going up back
(>1.041) is the last support for me
Attached Image