DislikedI did not use the fib calc excel as my basis for entry. my entry was already triggered before I checked it from the calc excel file. I myself is confused with the rules. But I somehow noticed that the values in the excel file is a bit close to the values generated by the Pivots D4 indicator.Ignored
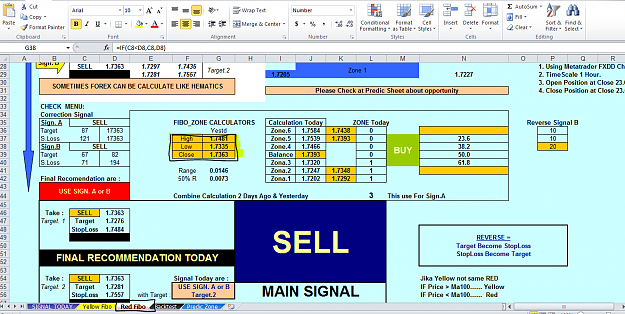
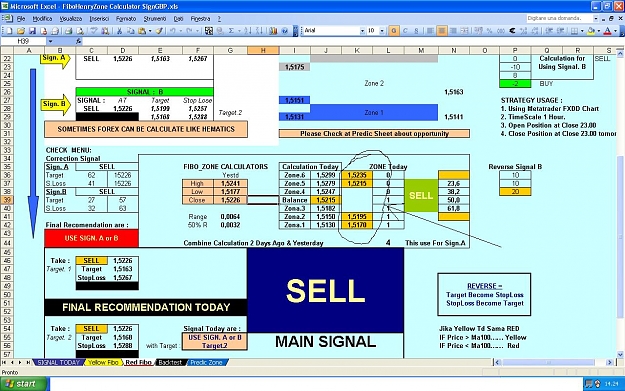
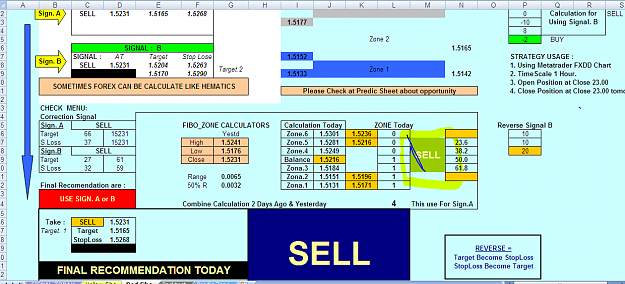
rstranger, yes, the concept behind is the calculation of pivots (HLC/3) combined with the calculation of fibo support/resistance (.618 and 1.382).
If you combine all together you have viable price reaction levels.
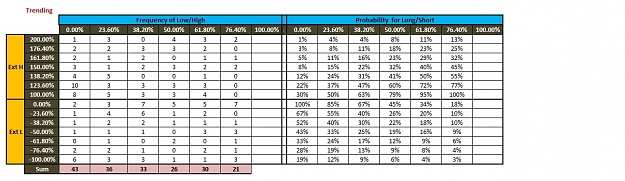
From this basis you can calculate probabilities about which levels will most likely be triggered by prices and therefore you will know direction and reversal points.
In pdf I attached there are calculation formulas.
So yellow and red signals are calculated computing the ratio between HLCs and fibo zones of last 2 days; green signal or gbp calc (I suppose they are the same otherwise we should have 4 signals instead of 3) is calculated computing the ratio between HL of 2 days ago and the close of yesterday and somehow the same for fibo zones...this is what I have understood.
Thks you rstranger now we have the no-password excel file.
It would be great if someone could compare march/april 2006 data with the backtest sheet..maybe we could have some more confirmations. I know that is possible to download historical data for free from Dukascopy but I'm not clever in doing that, so please we need a volunteer