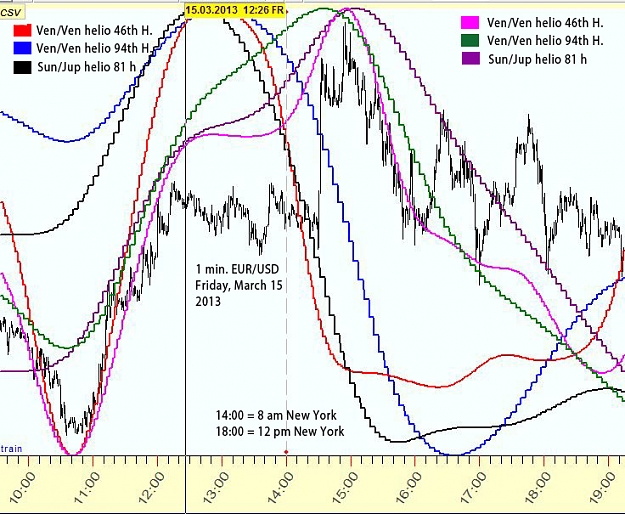
Test of 1 Minute chart forecast, EUR/USD Friday, March 15th 2013
The magenta, green and violet lines show the astro "prediction" after the bars were printed on the 1 min. chart, New York session, 8 am - 12 noon... It sure looks like the astro movements could keep you on the right side of the market during the morning session.
The blue, red and black lines shows what happened to the "prediction" when the data from 14:00 (8 am) forward was removed and the same astro lines applied. Notice the dramatic prediction to go short around 13:30.. had you done that, you would have been down 26 pips to the morning high at 17:00. You would have recovered if you weren't using a stop and just hung in there "hoping" the market would return however...
Attached Image (click to enlarge)