Markus
%100 agreed.
I am posting the same thing for ages about tick chart
it guides the MKT not the Daily Chart
-Fact; Every Trend Start with Single Tick, Rest is Matter of Fact
& I found the answer.
the answer is average main cycle period.
do you remember I had posted the cycles for micro main & marco
& Average micro cycle period was always 14 @ all TF s
now,
when Main cycle actual period count is > then average value trader should jump to one big TF
due actual TF overshooted.
its not valid.
DislikedWalker, Walker, you have questions LOLLOL
From a pure Elliottican point of view:
a) waves are fractal (wave in wave in wave etc.)
b) there is a common misinterpretation of that regarding TF's: seeing a wave and applying different TF's on it is less looking for fractals but more applying simplistic view on it. That means: when we have a 1 minute chart with (say) 5000 bars, it is difficult to see the forest for the trees. So we frequently apply a higher TF on it like the 15min, 1h or 4h for example. In this way...Ignored
Dislikedalways trying to find new & better way to trade.
cant sleep tonight again ( as usual )
was playing with charts.
a question come up.
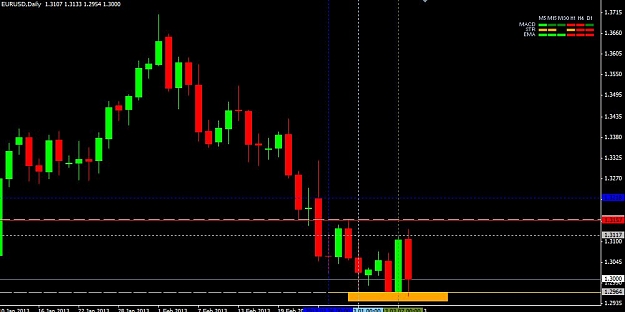
lets say we are using
15M
60M
240M charts
which one price trading?
they all have TL s levels.
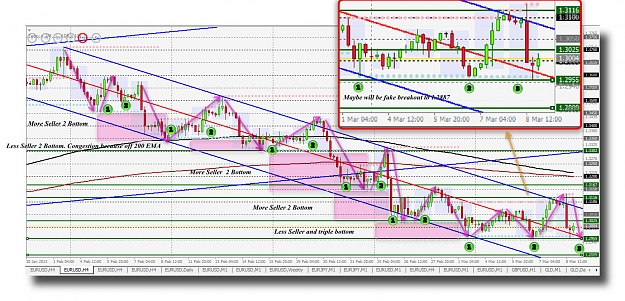
fractals are the newest consolidated levels. ( highs or Lows )
can we say the newset fratal printed ( upper or lower ) on chart its done. actually consolidated so we should look for unconsolidated chart(s)?
or vice verseIgnored