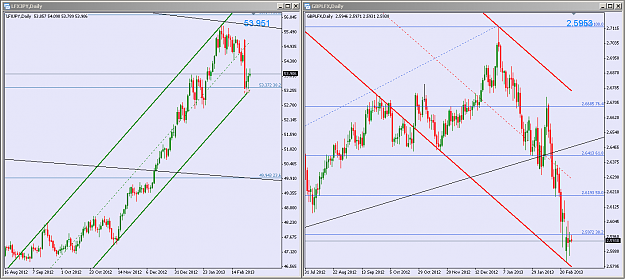
DislikedHey buddy, While I'm not saying the dragon will fly, I had to reply to you comment about bullish PA on the daily. To me, this shows some pretty strong buying going on around a good SR area. As I said in a previous post, for me the last daily needed to close above the 50% (I actually said 140ish as that would have been better...lol) but it did.
Take a look. Your thoughts on this chart?Ignored
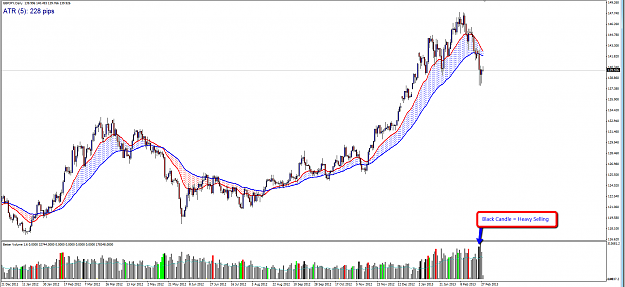
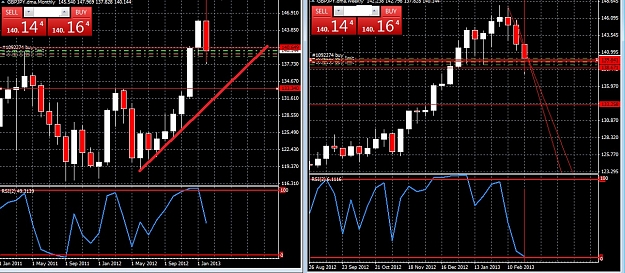
2nd thing is the amount of selling volume which was seen on 2-25! There was more volume on that day then there was on ANY day of the entire past 12 months. Take a look a the Black candle on 2-25.
Colors:
Red = Heavy buying
Black = Heavy selling
Green = Heavy buying and selling
Grey = normal volume
Yellow = low volume
*I definitely could be wrong though in my assumptions and my account will pay for it if I am.
Attached Image (click to enlarge)