Hi All,
This is how I played out and marked up my chart yesterday. It would of been a succesfull trade. Oh how I wish it was a live account. Ignore the lot size used to trade I realise its high risk etc I just clicked buy and left it to see if I got the direction right.
Willowgal this sort of answers your questions to spud also. Its my take on what went on yesterday. I have attached a pic and my thought process.
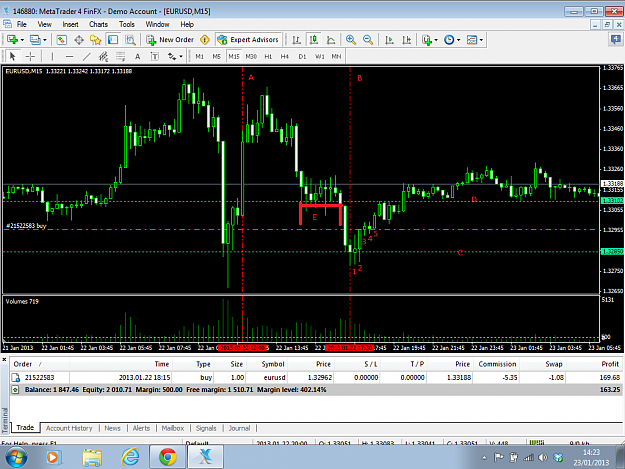
Lines A, B are peak volumes to get a base for price levels.
At line C I set a price line at 1.32850. I know this only intersects 1 bar. But price seems to hit resistance so I thought it was a good level to place.
Bar 1. bar is up. Volume is down. But reading spuds post after a spike bar, volume is always less. So expected.
Bar 2. Bar is up. Volume is also slightly higher. (Or equal its hard to tell with bar 1's volume) starting to lean to a buy bias. Which also matches what the chart is doing.
Bar 3. Bar is up. Volume down. Though as this bar is also small in size I expect the volume bar to be lower in height. Still no trade decision.
Bar 4. Bar Down. Volume down. This time the volume is also less than Bar 3. To me this is proving its a buy situation.
Bar 5. I enter a buy at the opening of this bar. My target is 1.33102. I didnt set a TP for this trade. I'm only trying to guess the direction at the moment. The reason I chose this target? Look at support at E. The price line sticks to the rules it ends in a 0 and price was affected at this price level. It was a support line until was broken through.
In hindsight looking at the charts today my TP line was spot on. Price returned to this line this morning around 8.45am GMT today.
I know this is not exactly how spud trades and explained but its what I felt is right for the situation. Adding a little supply and demand theory it worked out. Now to be consistent Time will tell.
This is how I played out and marked up my chart yesterday. It would of been a succesfull trade. Oh how I wish it was a live account. Ignore the lot size used to trade I realise its high risk etc I just clicked buy and left it to see if I got the direction right.
Willowgal this sort of answers your questions to spud also. Its my take on what went on yesterday. I have attached a pic and my thought process.
Lines A, B are peak volumes to get a base for price levels.
At line C I set a price line at 1.32850. I know this only intersects 1 bar. But price seems to hit resistance so I thought it was a good level to place.
Bar 1. bar is up. Volume is down. But reading spuds post after a spike bar, volume is always less. So expected.
Bar 2. Bar is up. Volume is also slightly higher. (Or equal its hard to tell with bar 1's volume) starting to lean to a buy bias. Which also matches what the chart is doing.
Bar 3. Bar is up. Volume down. Though as this bar is also small in size I expect the volume bar to be lower in height. Still no trade decision.
Bar 4. Bar Down. Volume down. This time the volume is also less than Bar 3. To me this is proving its a buy situation.
Bar 5. I enter a buy at the opening of this bar. My target is 1.33102. I didnt set a TP for this trade. I'm only trying to guess the direction at the moment. The reason I chose this target? Look at support at E. The price line sticks to the rules it ends in a 0 and price was affected at this price level. It was a support line until was broken through.
In hindsight looking at the charts today my TP line was spot on. Price returned to this line this morning around 8.45am GMT today.
I know this is not exactly how spud trades and explained but its what I felt is right for the situation. Adding a little supply and demand theory it worked out. Now to be consistent
Attached Image (click to enlarge)