I strongly suggest all the thread readers to read this post many, many times and ponder, ponder a lot about what I wrote. Because learning the mindset, the search for cues and training the eye may turn your trading career outcome.
Hello,
please consider the following points as they are VITAL for your trading success. They are a plethora of very very thin cues that you MUST learn and train your eye to spot or you won't be profitable.
1)
Correct. Plus as FXGroup explained, there's a strong descending trend line delimiting the market.
Now, this "Price was in a long term downtrend" is a cue of great importance.
Why?
Because this method insists on making you trade only when the three observed time frames are concording.
This makes your:
statement not applicable.
2)
You did not draw the monthly trend line and this surely affected your weekly analysis (bar closed above, seek for bullish signal on daily).
But you did not really need it. What you need is lots and lots of "screen time" involving training your eyes to spot the bars behaviors.
- Look at the bar next to the bullish bar which closed above: a bearish PB and it's above a RN. That's right, it's a Round Number but it's far from being as powerful as a BRN.
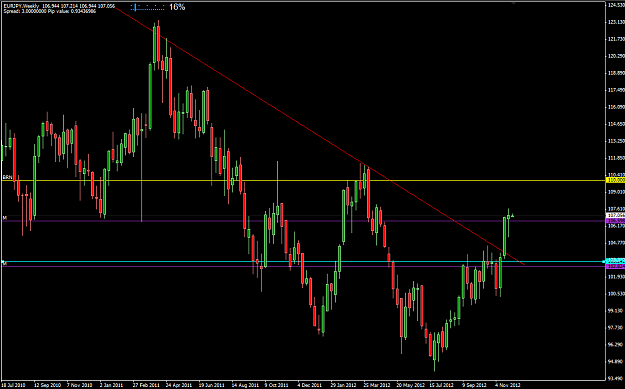
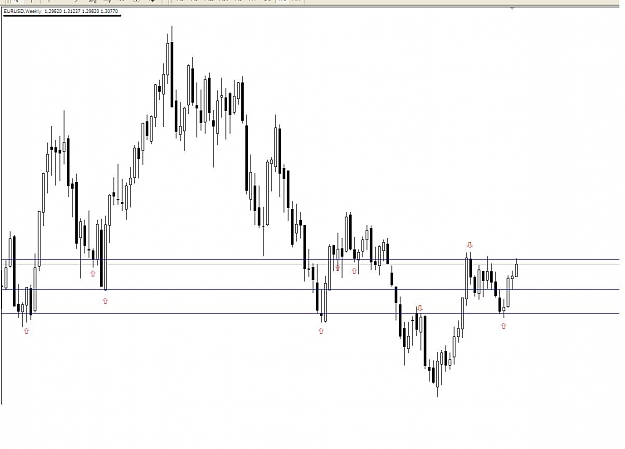
- Price follows its own pace not our beliefs / hopes / illusions. You should not draw RNs unless price really shows it's affected by them in a reliable way. Instead of that RN I'd have drawn the weekly price level, which sits above that PB. Why? Please look at the attached weekly chart (the first).
There are several bars hitting the cyan (weekly) level, some take liquidity off it. The weeks past Sept 2012 use the same level as resistance for a RM. The PB itself closes inside the the bar before it not above.
Basically that W PB - except for closing above a RN - is a perfect short setup for the Sept 2012+ RM.
- The bar past the bearish PB is not a bullish PB but it's a doji. Dojis mean buyers vs sellers battle, not "go long" or "go short", therefore it's not a trigger for a trade.
The doji closes inside the bearish PB anyway.
3)
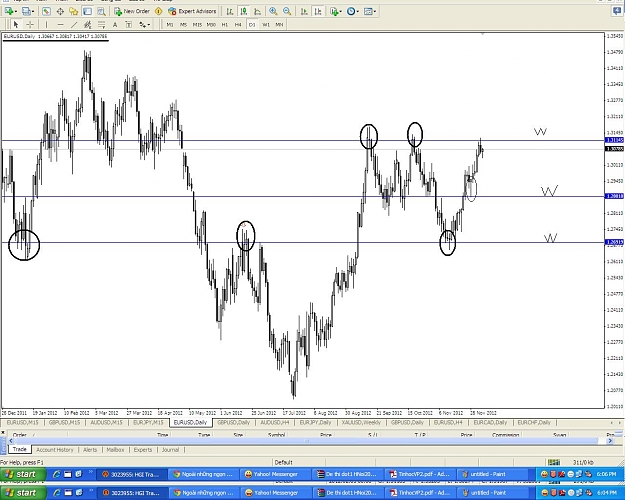
Let's look at the daily chart.
- Bar in blue rectangle indicated as "perfect long setup": due to the above considerations it's not a long setup to begin with. But anyway:
a) The PB does not sit on the bottom of a swing. This fact alone completely renders your trade dangerous. These days I just discard those setups, no "ifs", no "buts".
b) It's very very thin. PBs with no body are unreliable in my experience, they are an hybrid between a PB and a doji.
c) It hits the RN but only with the liquidity / tail "tip". Those bars produce weaker momentum.
d) It does its job. There are two rules about PBs first (not necessarily only) target = if PB sits on a level then first target = high of prior bar. If PB liquidity sits on a level then first target = top of the body of prior bar. This particular PB hit both targets. Therefore by using another of FXGroup's methods you could have profitably traded that bar even if the whole setup was fail.
- Subsequent bars you indicated as further setups that failed:
a) of course, you are going against a strong monthly and weekly trend... In fact the bearish W PB I discussed above set the W trend to bearish. The trend is your friend, going against it does not bode well.
b) The first would fail anyway even if you were in a strong bullish trend: too small and weak, it comes after a strong bearish downtrend. Being small and taking low liquidity and being smaller than the bars prior to it, how do you expect it can turn price's inertia at once?
c) The first would fail anyway because it closed few pips below the weekly level.
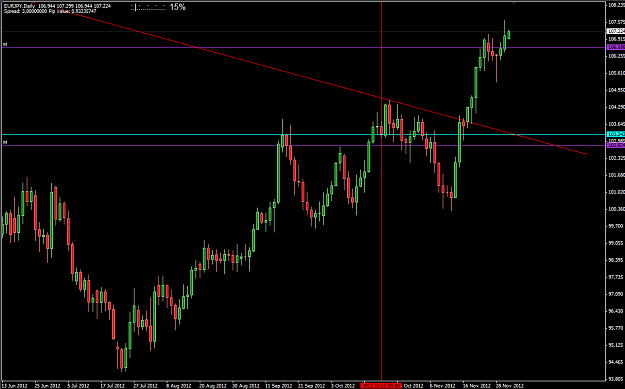
d) The next second and third bars failed because... they don't exist! This is a major hassle of using non UTC based platforms, you get spurious week end candles that can totally wreck your analysis. Now, please look at the second attachment. You'll see just one bar and it's a textbook pin bar.
e) However despite the PB shape, it still closed below the weekly level (cyan) and is just below the powerful descending trend line above it. The risk:reward is just not here even if it closed above the weekly level.
f) Even then, the PB did its basic job of making price go up to the prior (higher, so it's 2 candles before it) bar high. So you could actually have traded long and made a quick profit! This - as said above - involves another FXGroup method called "Daily". It's a fairly high risk method though so not suitable to be used by new and even "medium experience" traders.
I hope that despite my terrible English, I managed to convey the whole deal of looking at price. A quick glance is not enough, not before you have multiple years of experience.
----------------
DislikedHello FXGroup and fellow traders.
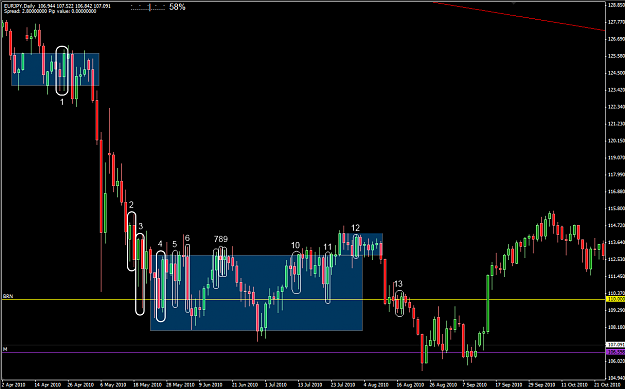
Today, I did some backtesting on the EURJPY and i found something interesting.
M: In RM. Price was in a long term downtrend, with RN103 being the passed through a few times.
W: In RM, after a small uptrend. W price closed above M R + RN103. (19.10.2012)
D: Price retested RN130, and PB formed, after sellers got rejected right at RN103. A perfect signal for LONG entry. however, this ended up a loss.Ignored
please consider the following points as they are VITAL for your trading success. They are a plethora of very very thin cues that you MUST learn and train your eye to spot or you won't be profitable.
1)
DislikedM: In RM. Price was in a long term downtrend, with RN103 being the passed through a few times.Ignored
Now, this "Price was in a long term downtrend" is a cue of great importance.
Why?
Because this method insists on making you trade only when the three observed time frames are concording.
This makes your:
2)
You did not draw the monthly trend line and this surely affected your weekly analysis (bar closed above, seek for bullish signal on daily).
But you did not really need it. What you need is lots and lots of "screen time" involving training your eyes to spot the bars behaviors.
- Look at the bar next to the bullish bar which closed above: a bearish PB and it's above a RN. That's right, it's a Round Number but it's far from being as powerful as a BRN.
- Price follows its own pace not our beliefs / hopes / illusions. You should not draw RNs unless price really shows it's affected by them in a reliable way. Instead of that RN I'd have drawn the weekly price level, which sits above that PB. Why? Please look at the attached weekly chart (the first).
There are several bars hitting the cyan (weekly) level, some take liquidity off it. The weeks past Sept 2012 use the same level as resistance for a RM. The PB itself closes inside the the bar before it not above.
Basically that W PB - except for closing above a RN - is a perfect short setup for the Sept 2012+ RM.
- The bar past the bearish PB is not a bullish PB but it's a doji. Dojis mean buyers vs sellers battle, not "go long" or "go short", therefore it's not a trigger for a trade.
The doji closes inside the bearish PB anyway.
3)
Let's look at the daily chart.
- Bar in blue rectangle indicated as "perfect long setup": due to the above considerations it's not a long setup to begin with. But anyway:
a) The PB does not sit on the bottom of a swing. This fact alone completely renders your trade dangerous. These days I just discard those setups, no "ifs", no "buts".
b) It's very very thin. PBs with no body are unreliable in my experience, they are an hybrid between a PB and a doji.
c) It hits the RN but only with the liquidity / tail "tip". Those bars produce weaker momentum.
d) It does its job. There are two rules about PBs first (not necessarily only) target = if PB sits on a level then first target = high of prior bar. If PB liquidity sits on a level then first target = top of the body of prior bar. This particular PB hit both targets. Therefore by using another of FXGroup's methods you could have profitably traded that bar even if the whole setup was fail.
- Subsequent bars you indicated as further setups that failed:
a) of course, you are going against a strong monthly and weekly trend... In fact the bearish W PB I discussed above set the W trend to bearish. The trend is your friend, going against it does not bode well.
b) The first would fail anyway even if you were in a strong bullish trend: too small and weak, it comes after a strong bearish downtrend. Being small and taking low liquidity and being smaller than the bars prior to it, how do you expect it can turn price's inertia at once?
c) The first would fail anyway because it closed few pips below the weekly level.
d) The next second and third bars failed because... they don't exist! This is a major hassle of using non UTC based platforms, you get spurious week end candles that can totally wreck your analysis. Now, please look at the second attachment. You'll see just one bar and it's a textbook pin bar.
e) However despite the PB shape, it still closed below the weekly level (cyan) and is just below the powerful descending trend line above it. The risk:reward is just not here even if it closed above the weekly level.
f) Even then, the PB did its basic job of making price go up to the prior (higher, so it's 2 candles before it) bar high. So you could actually have traded long and made a quick profit! This - as said above - involves another FXGroup method called "Daily". It's a fairly high risk method though so not suitable to be used by new and even "medium experience" traders.
I hope that despite my terrible English, I managed to convey the whole deal of looking at price. A quick glance is not enough, not before you have multiple years of experience.
Attached Image(s) (click to enlarge)