DislikedThis thread is a very good indicator of what is going on.
Bull market: peaceful and normal discussion.
Bear market: the girls will come out screaming 'I told you so'.Ignored
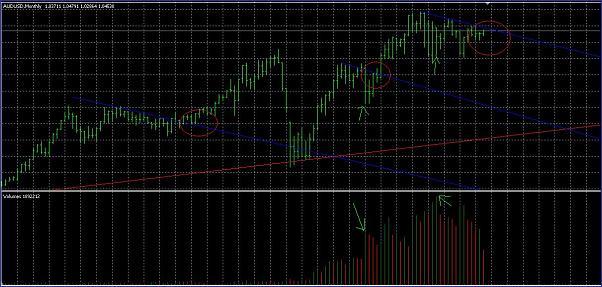
OK so some objective analysis... here we can see that AU has been in a multi-year uptrend (RED TL) as denoted by the touch in 2008 during the crash and then a higher high.
Postulate #1: We know that prior to the 2008 crash it broke the first bearish TL to do a short covering rally which lasted up until the crash.
Postulate #2: The same thing happened in 2009 as the second bearish TL was broken (second red circle reading left to right).. here is where it gets interesting, read below.
Postulate #3? Now we are at a point where the blue TL bearish has been created again and is about to break meaning a short covering rally is in order.
Volume analysis tells us that peak volume came in at the low range of the consoldations followed by the blue TL breaking. This can be seen in 2009 and lately in 2011... which is about to precede a blue TL break.
Now conventional volume analysis might lead to you believe that there is major distribution going on as no higher highs have been made and there was very high volume in 2011, highest ever. While it has trailed off and still no higher highs... usually a bearish sign, however it might just mean that there was major bear consumption happening by a larger bull that took a long time because of sheer size of the upcoming bull run that is about to take place... the length of time it has consolidated on the monthly shows this, if the TL is broken successfully. In fact there were 2 peak volume periods during this consolodation and both happened at the bottom of their respective ranges during this consolodation phase. (Think of it as a sort of test of the low, which remained intact.. the one with the highest volume in 2011), low of around 0.9375...
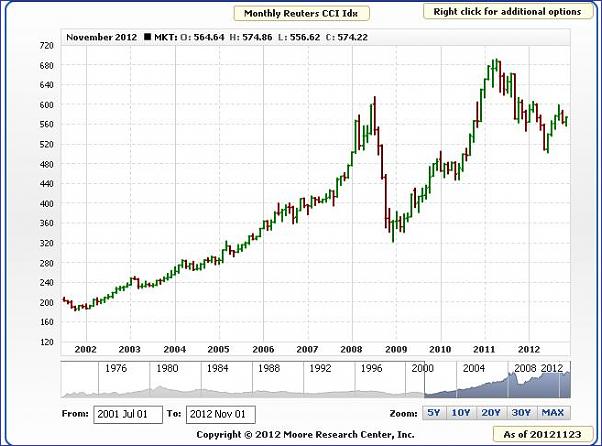
What edges me towards the bull side for the short time period is 2 things.... one is the fact that there is usually some stop hunting before a trend change meaning a resistance gives, small or big.. secondly if we look at the CRB Commodity Index chart (attachment #2).. you can see that the charts are correlated except that AU has been outperforming the recent selloff in commodities over the past year and a half... Gold soldoff so did cotton coffee etc, but AU lows during that peak volume remained. CRB shows a series of lower lows while AU shows consolodation about to break on the bullish side. This means that commodities are way oversold or that AU is overvalued... Either way they should catch up to each other once the real move sets in.
As you can see that AU volume consumed bears while commodities including gold sold off and AU remained on top of its monthly chart range. This might be accumulation volume that will take it up to 1.25 and beyond perhaps before the next correction or trend change.
That is on the bull side.
Now either you are a market bear or market bull because I don't currently see how AUD will go off on its own with commodites diverging away from AUD USD exchange rate... that is to say that as AU goes so does commodites and vice versa.
Market bulls will say that the commodity super bull is not over... and this includes that gold's 12 year bull is not over.. if you believe that the current monetary policy is too loose and we will run into inflation problems sooner rather than later then you can safely say that commodities should make higher highs.
There are those that say commodity bubble has burst and USDx will rise... does that mean AUD USD follows commodities down until it creates a good base? The only way I see divergence happening is if RBA ACTS and doesn't talk.. like SNB or BOJ... if they do then it is up to the market to decide if they will test RBA's resolve or leave it.
Remember that interest rate differential of AUDUSD is still positive and it is attractive to large funds to sit when the commodities are to rise.
I believe that AUDUSD will break the blue TL... so short term I'm a bull and have been for a while now.
Attached Image(s) (click to enlarge)