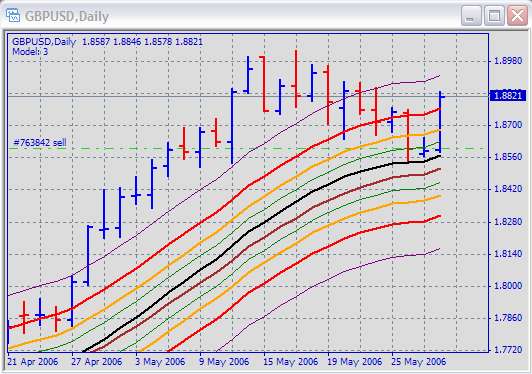
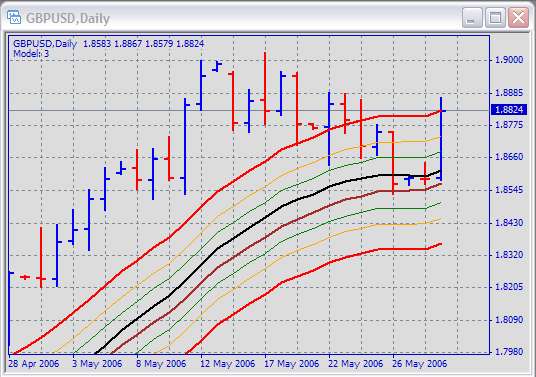
These two charts use the identical mq4 file for calculating the tunnel and fibs, however one chart is from InterbankFX Demo and the other is from StragegyBuilderFX Demo. As you'll see the tunnel and fib indicators are quite a bit different from one chart to the next. I notice the prices on each are pretty close right now however the daily highs and lows seem to be off quite a bit at least for today.
I'm wondering if this difference is generated in the times that each brokers uses to open and close their trading day - this is one explanation. Any other thoughts?
SBFX
http://www.forexfactory.com/forexfor...tid=5650&stc=1
InterbankFX
http://www.forexfactory.com/forexfor...tid=5651&stc=1
I'm wondering if this difference is generated in the times that each brokers uses to open and close their trading day - this is one explanation. Any other thoughts?
SBFX
http://www.forexfactory.com/forexfor...tid=5650&stc=1
InterbankFX
http://www.forexfactory.com/forexfor...tid=5651&stc=1