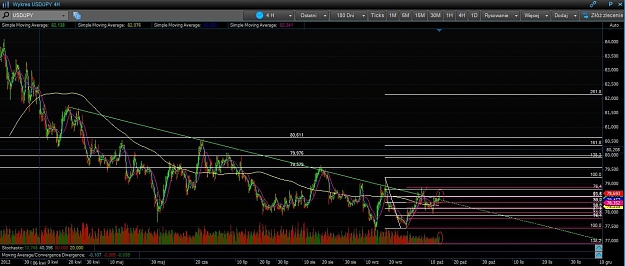
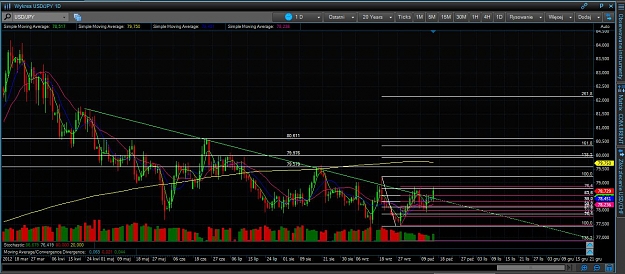
DislikedIm not much of one for Technical Analysis but ive attached a pic here of a trend Ive been keeping an eye on. It is a daily chart and trend starts around April.
What are your thoughts on this descending triangle?
Seems nearly everytime 78 level is hit however that theres some strong buying going on.Ignored
Attached Image (click to enlarge)
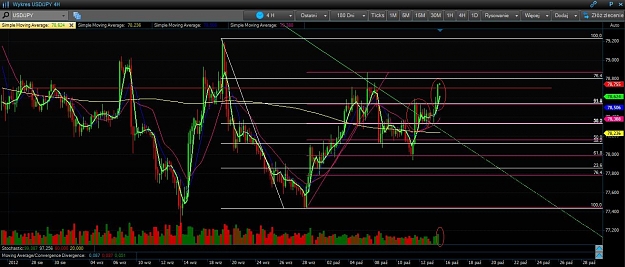
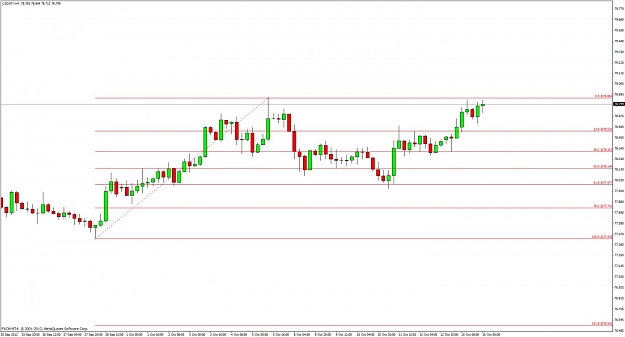
With SPX looking bullish for the moment, I'd be looking for this to break upwards with a lot of momentum. Difficult to trade on the daily, as it may or may not retest the trend line if it breaks. But handy for the lower time scale.
Gone to a better place