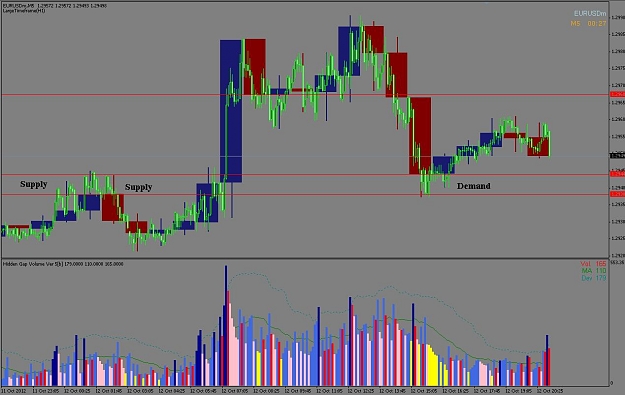
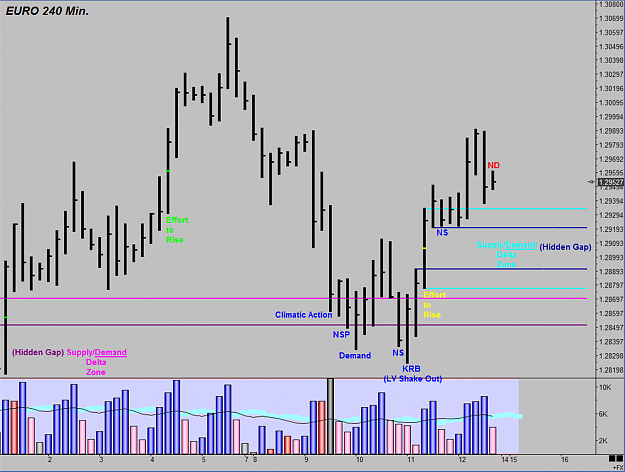
I don't like to focus on a bunch of time frames, but this 240 chart has been very nice of late.
There was a nice opportunity to get long in the last few days.
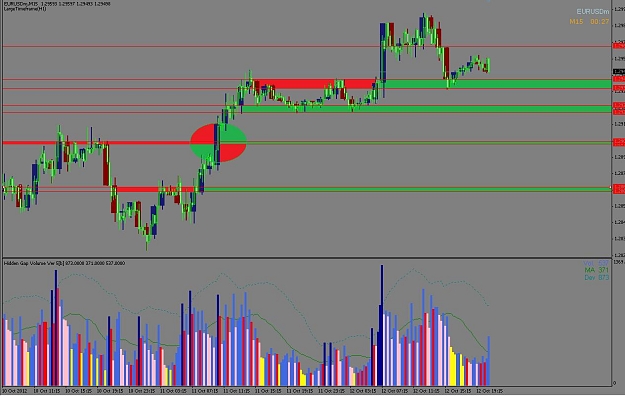
The last interval from Friday was a narrow range up bar on volume less than the previous two intervals. This is No Demand.
Whilst this is No Demand, that does not mean one should just go short. One needs to look at the background first. The background is strong. It is very likely that we will now see a Test. A Test wold be a down bar closing near the high on volume less than the previous two intervals. Ideally, we would like price to fall back on/into the new Supply/Demand Zone and then have the Test appear.
It would not be surpising to see prices fall at the outset on Sunday night and recover to close on or near the high by Monday's close.
What are those of you who actually trade this time frame looking for?
There was a nice opportunity to get long in the last few days.
The last interval from Friday was a narrow range up bar on volume less than the previous two intervals. This is No Demand.
Whilst this is No Demand, that does not mean one should just go short. One needs to look at the background first. The background is strong. It is very likely that we will now see a Test. A Test wold be a down bar closing near the high on volume less than the previous two intervals. Ideally, we would like price to fall back on/into the new Supply/Demand Zone and then have the Test appear.
It would not be surpising to see prices fall at the outset on Sunday night and recover to close on or near the high by Monday's close.
What are those of you who actually trade this time frame looking for?
Attached Image (click to enlarge)
Wyckoff VSA: (1) Supply & Demand (2) Effort vs. Result (3) Cause & Effect