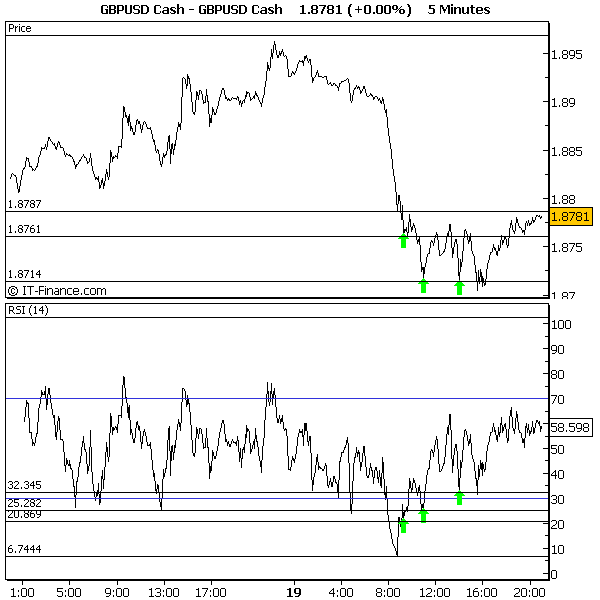
Understanding Divergence,below example (over-sold position) used on 5-minute RSI.
Cable retraces to lows of 1.8787,RSI hits major 5-minute low of 6.744.
Cable rebounds slightly but nothing significant. The selling continues, cable hits 1.8761, the rsi is in a rising uptrend to 20.869 forming divergence 1. Cable tries to attack 1.8787 but fails.
Selling continues, cable retraces to 1.8714, rsi still on the uptrend to 25.28 forming divergence 2. Cable rebounds with buying, attacks former trend line of 1.8761, but fails to attack 1.8787. Selling continues and cable retraces back to 1.8714 area, this now forms divergence 3, rsi 32.34 ( this in my opinion should be your entry point ).
Cable rebounds once again to test (new trend line) 1.8761, breaks slightly above trend line,retraces then pushes for a second attack,fails, sharp retrace to (new trend line) 1.8714. At this trend line it suggests on the 5 minute chart that selling is running out of steam. Cable rises on a nice steady uptrend to present position.
Matrix.
Attached Image