I am a relatively new trader and I have made too many mistakes on both trusting and not trusting my instincts.
I am currently trying a new system and it seems to be working out for me. Therefore, this thread is here to help me keep track of my performance and trades. Hopefully, I will be able to help some newcomers as well, although there are probably a lot more experienced traders here to do that.
---
Explaining my system:
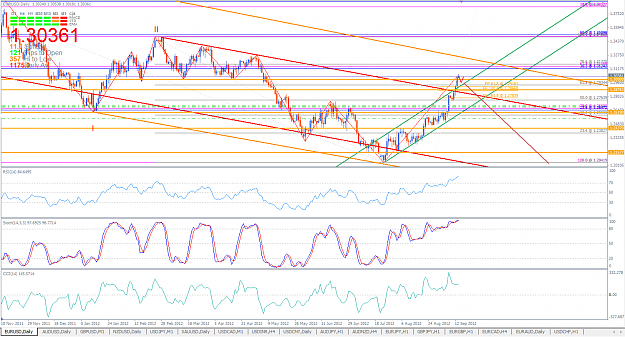
I used to complicate my charts with all sorts of garbage, indicators, lines, dots, arrows. Everything was everywhere. I decided to remove all the junk so I can have a clear view of what's most important. The candlesticks.
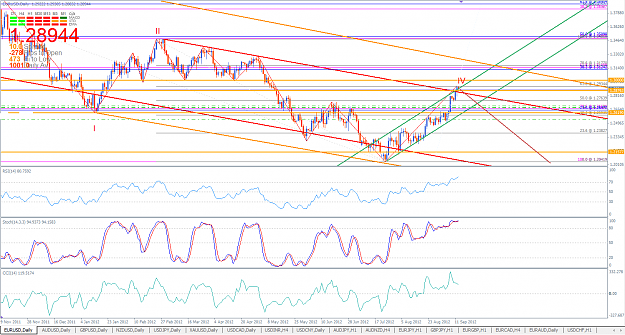
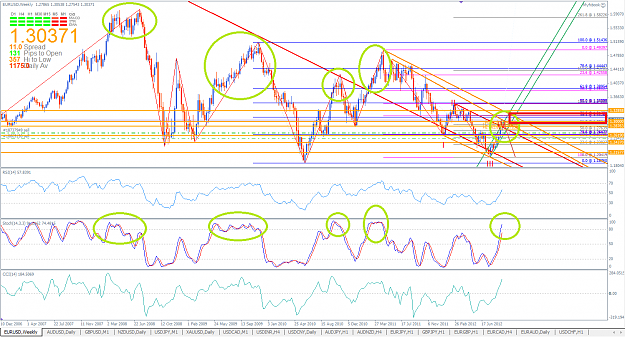
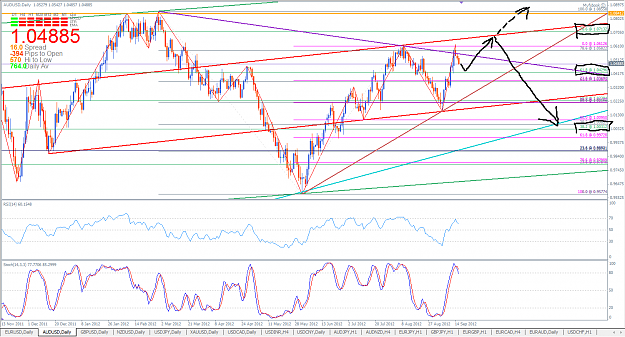
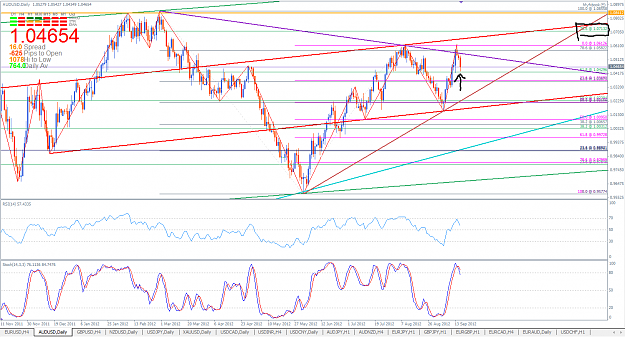
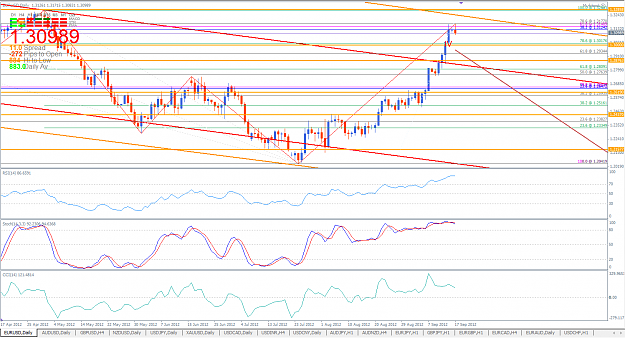
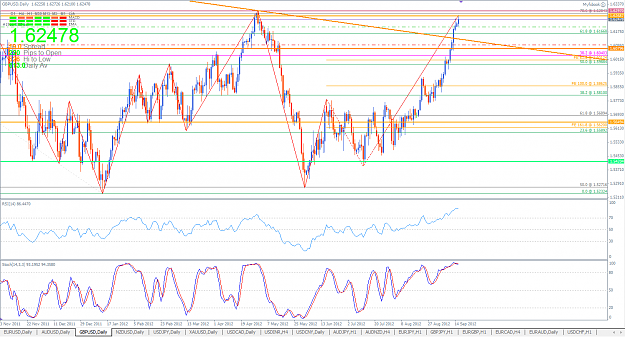
I re-charted everything. Making use of major and minor trend lines as well as major and minor fibonacci levels. I will occasionally make use of fibonacci expansions to find out the next price movements / retracements. I also make use of obvious support and resistance levels that don't come from fib levels on my chart but have been tested over and over in the past.
I am trying a new plan to start trailing stops every 15 / 25 pips (haven't decided), to catch a trend.
Edit: 18 September 2012
I have removed some indicators from my charts. Namely Stochastics and CCI from my EURUSD chart. I have also added a Daily Pivots indicator. I will base my trades solely on Support and Resistance as well as Fib levels only.
8 October 2012: I have decided to add Stochastics back into my charts.
Edit: 19 September 2012
My system does not rely on news fundamentals at all. It relies solely based on technical fundamentals. I do not believe in news fundamentals UNLESS the news would be coming out at significant key support or resistance levels. Most of the time when one pair is overbought and news brings it even higher, I would expect a large retracement to follow suit. If you're a person who relies on news fundamentals, you may find that my system does not compliment it but it does take into account that some movements may require news fundamentals.
Edit: 20 September 2012
I know this is a newbie's mistake. But I rarely trade with stop losses. I have decided that from now on, I will do PO's on fib levels or past support and resistance levels and place a stop loss roughly 10 - 15 pips in the opposite direction of my target. This edit is here to remind me how not putting a stop loss will kill you off faster than holding on and waiting for a turn around. If you are a new trader and you are reading this, trust me, stop losses are so important. I regret not making good use of it. With the implementation of stop losses to my trading system, I am confident of making better trades with better risk-to-reward by making use of trailing stops, roughly 15-25 pips per stop.
Edit: 23 September 2012
Going to try out PipTrapper's MACD indicator. If it works in my system, I will adopt it for future uses. (Will keep in my charts.)
Edit: 4 October 2012
Going to try out tmoney5474's channel surfing indicator that comes with price levels at the end of it. If it works in my system, I will adopt it for future uses.
Edit: 5 October 2012
I have decided to learn Elliot Wave Principle and add it to the way I trade. I have also removed the RSI indicator from my chart.
Edit: 7 October 2012
I have also decided to learn Harmonic Patterns and implement it with Elliot Wave Principles to see how I can trade better. Many people tell me not to predict where price is moving but to be honest, this is something new for me to venture into. And majority of the times, the retracements, pullbacks and what not are indeed forming a harmonic pattern. Most people think its wise not to predict the movements, but the fact that harmonic patterns still exists proves that it does work for people and it works enough for it to continue to be traded as a system. I shall learn more and continue exploring and venturing deeper into the vast world of forex and continue improving on my system.
Edit: 17 October 2012
I realised that I am a way better scalper than a intraday or long term trader. Intraday trading isn't something I should do because I always look at my charts. So I have a new plan. I intend to continue scalping until I get all my losses back. With a target of 10% of my account a day. I will then look towards using two accounts. One that will hedge positions (might not do hedging), another for me to continue scalping.
If I do start up scalping, I will post up daily results (not charts). I also intend to put a small amount of risk for longer term purposes to earn some "extra income". I will see how this system goes because I'm enlisting into the army soon. Once I am done with army, I may continue scalping with a 15-20% target of my account a day, compounded into a month with 1 withdrawal only per month.
Target number of pips: 10
Stop loss: Depends on long term trend.
---
Once again, my trades taken here are entirely based on my own charts and ideas. Taking trades based on my ideas will be something you are willing to do at your own risk. Thus, I hope no one does that.
I will start posting my first trades after the FOMC "QE3" meeting today, hopefully closing all of my positions so I can start afresh for this.
---
ADD: 15 September 2012
I have decided to also experiment and try out using the Commitment of Traders Report (COT) as an indicator to see if I should go long or short in a certain pair.
The COT numbers can be retrieved here:
http://futures.tradingcharts.com/menu.html
I will post the numbers each weekend to see how it has faired. Should this method work out, I will upload a screenshot of my compilation weekly to help traders who are interested and have knowledge in using COT as well.
ADD: 18 September 2012
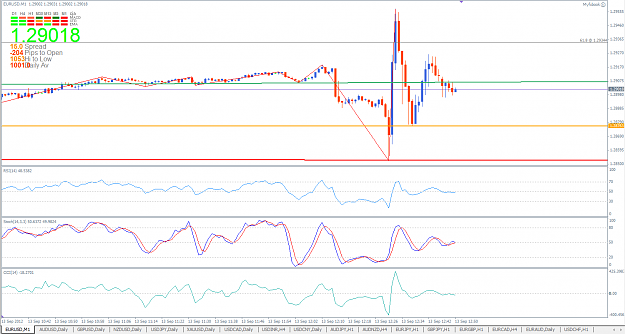
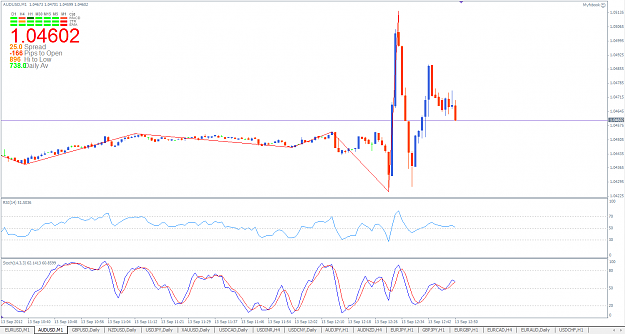
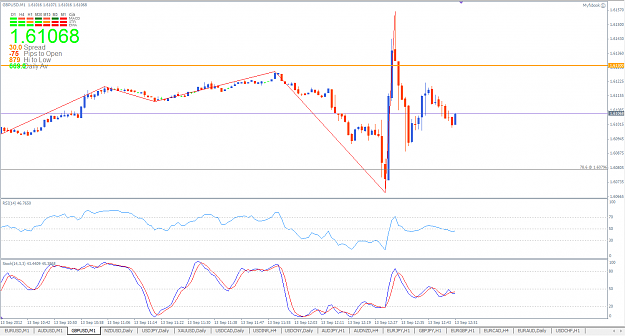
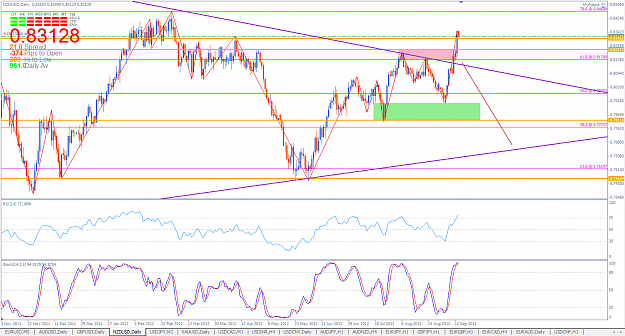
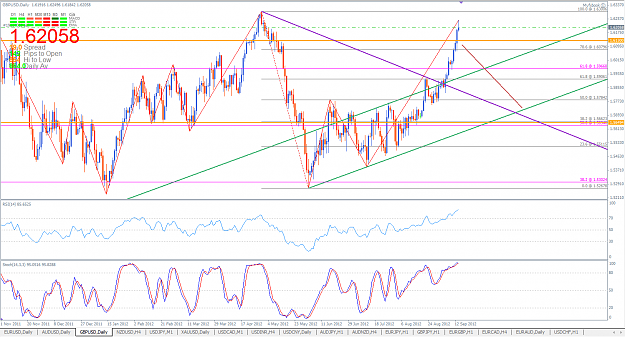
I will currently only be focusing on EUR/USD, AUD/USD and GBP/USD. I will occasionally take a look at USD/JPY, NZD/USD and USD/CAD to gauge some correlated PAs.
Once I am more experienced, I will keep my charts with mixed pairs of EUR/GBP, EUR/CAD, EUR/JPY, EUR/AUD, GBP/JPY, GBP/CAD, AUD/NZD, so on and so forth. First to recover all my losses and continue improving my system first.
ADD: 22 September 2012
I have decided to add COT indicators weekly when I have time.
Because the COT list is really long, I will not be showing the column headers. So the headers go like this:
Date | Non-comm Long | Non-comm short | Comm Long | Comm Short | Non-Comm Net Positions | Comm Net Positions | Net Positions | % Long for Currency | % Short for Currency | Notes / PA | % Long for USD | % Short for USD.
If you are using my COT information to make your trades, you just need to know that when the first 2 columns for the currency are green, it means net long has increased. When they are red, net shorts have increased.
Same goes for USD on the last two columns.
ADD: 4 October 2012
Because I've made such a huge loss and I will soon not be able to have time to trade. I will attempt to convert my trading method into a place entry order and set TP and SL way of trading. My trades will be based on fib levels and channels and I will always have a target of a minimum 100 pips with a 35 pip stop loss. If this method works out well for me, I will target a target for more pips whilst slowly decreasing the amount of stop loss. This is to test my accuracy of trades and perfect my entries.
I am currently trying a new system and it seems to be working out for me. Therefore, this thread is here to help me keep track of my performance and trades. Hopefully, I will be able to help some newcomers as well, although there are probably a lot more experienced traders here to do that.
---
Explaining my system:
I used to complicate my charts with all sorts of garbage, indicators, lines, dots, arrows. Everything was everywhere. I decided to remove all the junk so I can have a clear view of what's most important. The candlesticks.
I re-charted everything. Making use of major and minor trend lines as well as major and minor fibonacci levels. I will occasionally make use of fibonacci expansions to find out the next price movements / retracements. I also make use of obvious support and resistance levels that don't come from fib levels on my chart but have been tested over and over in the past.
I am trying a new plan to start trailing stops every 15 / 25 pips (haven't decided), to catch a trend.
Edit: 18 September 2012
I have removed some indicators from my charts. Namely Stochastics and CCI from my EURUSD chart. I have also added a Daily Pivots indicator. I will base my trades solely on Support and Resistance as well as Fib levels only.
8 October 2012: I have decided to add Stochastics back into my charts.
Edit: 19 September 2012
My system does not rely on news fundamentals at all. It relies solely based on technical fundamentals. I do not believe in news fundamentals UNLESS the news would be coming out at significant key support or resistance levels. Most of the time when one pair is overbought and news brings it even higher, I would expect a large retracement to follow suit. If you're a person who relies on news fundamentals, you may find that my system does not compliment it but it does take into account that some movements may require news fundamentals.
Edit: 20 September 2012
I know this is a newbie's mistake. But I rarely trade with stop losses. I have decided that from now on, I will do PO's on fib levels or past support and resistance levels and place a stop loss roughly 10 - 15 pips in the opposite direction of my target. This edit is here to remind me how not putting a stop loss will kill you off faster than holding on and waiting for a turn around. If you are a new trader and you are reading this, trust me, stop losses are so important. I regret not making good use of it. With the implementation of stop losses to my trading system, I am confident of making better trades with better risk-to-reward by making use of trailing stops, roughly 15-25 pips per stop.
Edit: 23 September 2012
Going to try out PipTrapper's MACD indicator. If it works in my system, I will adopt it for future uses. (Will keep in my charts.)
Edit: 4 October 2012
Going to try out tmoney5474's channel surfing indicator that comes with price levels at the end of it. If it works in my system, I will adopt it for future uses.
Edit: 5 October 2012
I have decided to learn Elliot Wave Principle and add it to the way I trade. I have also removed the RSI indicator from my chart.
Edit: 7 October 2012
I have also decided to learn Harmonic Patterns and implement it with Elliot Wave Principles to see how I can trade better. Many people tell me not to predict where price is moving but to be honest, this is something new for me to venture into. And majority of the times, the retracements, pullbacks and what not are indeed forming a harmonic pattern. Most people think its wise not to predict the movements, but the fact that harmonic patterns still exists proves that it does work for people and it works enough for it to continue to be traded as a system. I shall learn more and continue exploring and venturing deeper into the vast world of forex and continue improving on my system.
Edit: 17 October 2012
I realised that I am a way better scalper than a intraday or long term trader. Intraday trading isn't something I should do because I always look at my charts. So I have a new plan. I intend to continue scalping until I get all my losses back. With a target of 10% of my account a day. I will then look towards using two accounts. One that will hedge positions (might not do hedging), another for me to continue scalping.
If I do start up scalping, I will post up daily results (not charts). I also intend to put a small amount of risk for longer term purposes to earn some "extra income". I will see how this system goes because I'm enlisting into the army soon. Once I am done with army, I may continue scalping with a 15-20% target of my account a day, compounded into a month with 1 withdrawal only per month.
Target number of pips: 10
Stop loss: Depends on long term trend.
---
Once again, my trades taken here are entirely based on my own charts and ideas. Taking trades based on my ideas will be something you are willing to do at your own risk. Thus, I hope no one does that.
I will start posting my first trades after the FOMC "QE3" meeting today, hopefully closing all of my positions so I can start afresh for this.
---
ADD: 15 September 2012
I have decided to also experiment and try out using the Commitment of Traders Report (COT) as an indicator to see if I should go long or short in a certain pair.
The COT numbers can be retrieved here:
http://futures.tradingcharts.com/menu.html
I will post the numbers each weekend to see how it has faired. Should this method work out, I will upload a screenshot of my compilation weekly to help traders who are interested and have knowledge in using COT as well.
ADD: 18 September 2012
I will currently only be focusing on EUR/USD, AUD/USD and GBP/USD. I will occasionally take a look at USD/JPY, NZD/USD and USD/CAD to gauge some correlated PAs.
Once I am more experienced, I will keep my charts with mixed pairs of EUR/GBP, EUR/CAD, EUR/JPY, EUR/AUD, GBP/JPY, GBP/CAD, AUD/NZD, so on and so forth. First to recover all my losses and continue improving my system first.
ADD: 22 September 2012
I have decided to add COT indicators weekly when I have time.
Because the COT list is really long, I will not be showing the column headers. So the headers go like this:
Date | Non-comm Long | Non-comm short | Comm Long | Comm Short | Non-Comm Net Positions | Comm Net Positions | Net Positions | % Long for Currency | % Short for Currency | Notes / PA | % Long for USD | % Short for USD.
If you are using my COT information to make your trades, you just need to know that when the first 2 columns for the currency are green, it means net long has increased. When they are red, net shorts have increased.
Same goes for USD on the last two columns.
ADD: 4 October 2012
Because I've made such a huge loss and I will soon not be able to have time to trade. I will attempt to convert my trading method into a place entry order and set TP and SL way of trading. My trades will be based on fib levels and channels and I will always have a target of a minimum 100 pips with a 35 pip stop loss. If this method works out well for me, I will target a target for more pips whilst slowly decreasing the amount of stop loss. This is to test my accuracy of trades and perfect my entries.
A 1 pip gain is better than a 1 pip loss.