Hello all,
Here is a challenge I'm wondering if you might help me with. I have a TVI indicator (attached) that I am using.
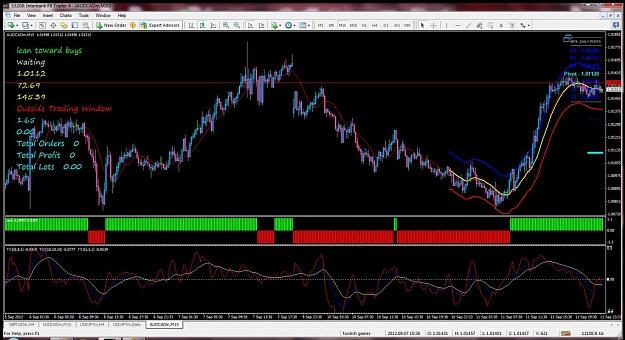
On my chart I have superimposed this indicator with two different settings. Obviously I was wanting to test directional bias with the crosses. However I find that these two indicators, although calculating the same line (just with different settings) do not line up on the chart correctly. The evidence is in the zero line for each indicator.
Thus the crosses that I see are not "true" because the scale for each indicator is different.
How can I make these two indicators (actually the same but again, with different settings) line up to the zero line so that the crosses can be read and back tested?
Thanks in advance
Here is a challenge I'm wondering if you might help me with. I have a TVI indicator (attached) that I am using.
On my chart I have superimposed this indicator with two different settings. Obviously I was wanting to test directional bias with the crosses. However I find that these two indicators, although calculating the same line (just with different settings) do not line up on the chart correctly. The evidence is in the zero line for each indicator.
Thus the crosses that I see are not "true" because the scale for each indicator is different.
How can I make these two indicators (actually the same but again, with different settings) line up to the zero line so that the crosses can be read and back tested?
Thanks in advance
Attached Image (click to enlarge)
Attached File(s)