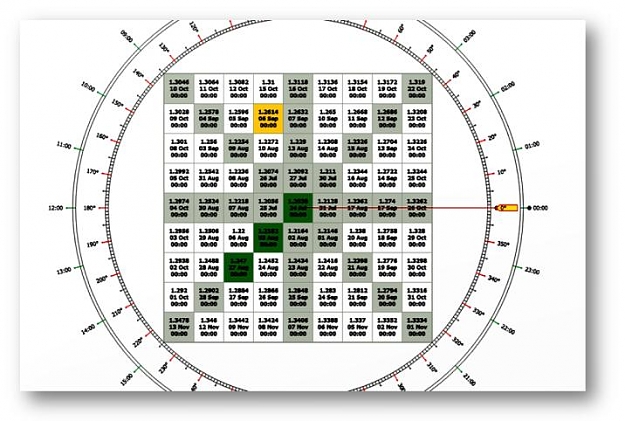
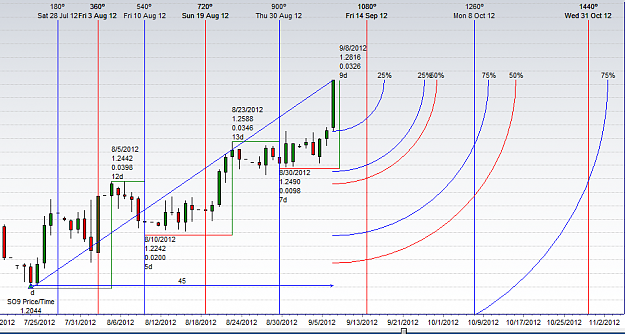
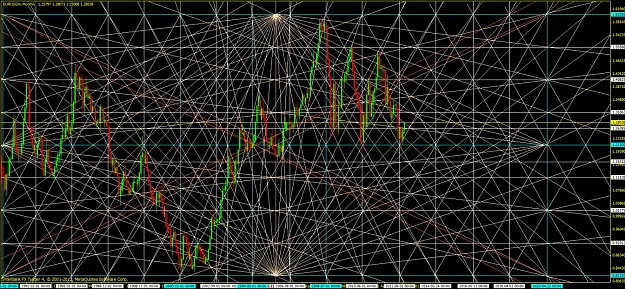
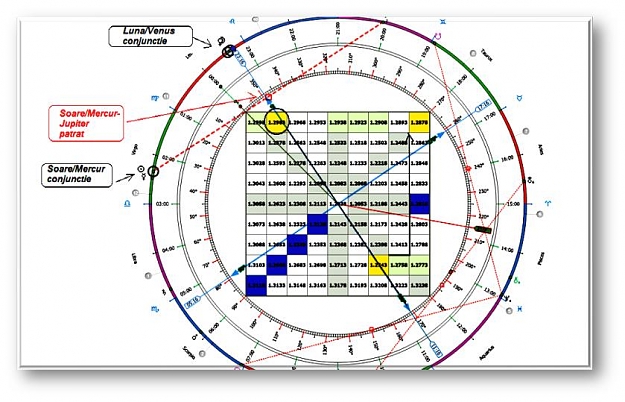
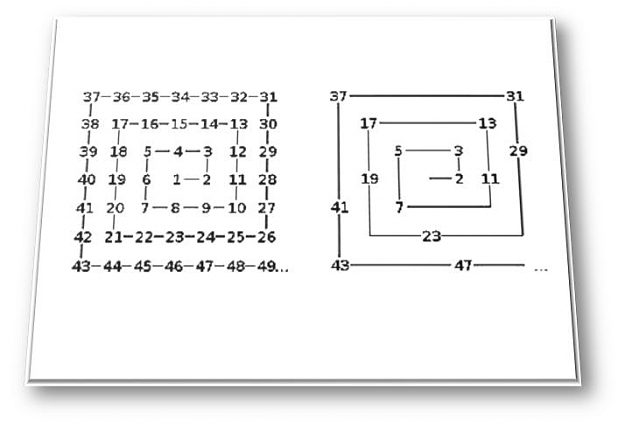
All right. Now something a little more relative. Application of SQ9 of Gann. Before using the above template square Gann I tried something with SQ9. But SQ9 is template. Both are entirely share great template. I think I showed earlier. I'll give you a link. For now, see here.
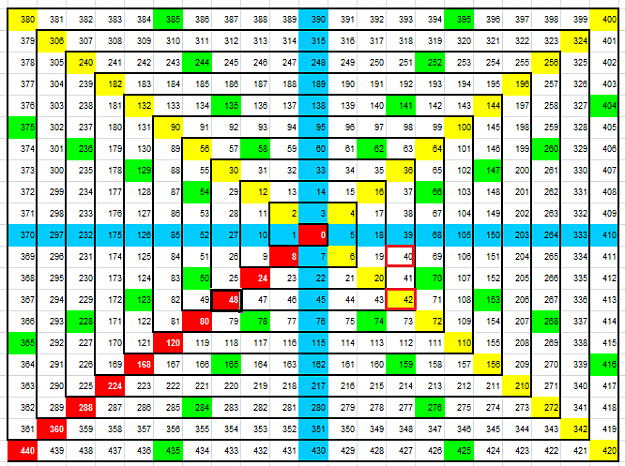
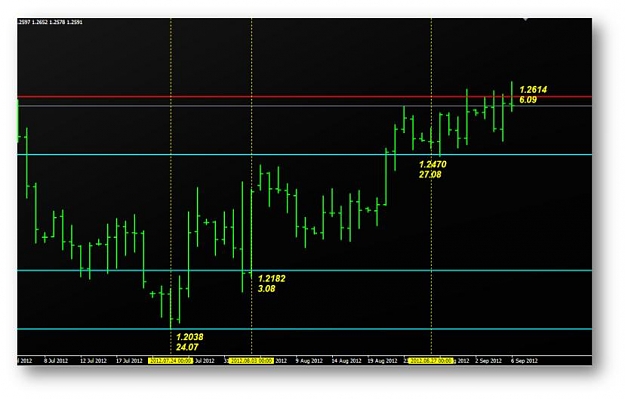
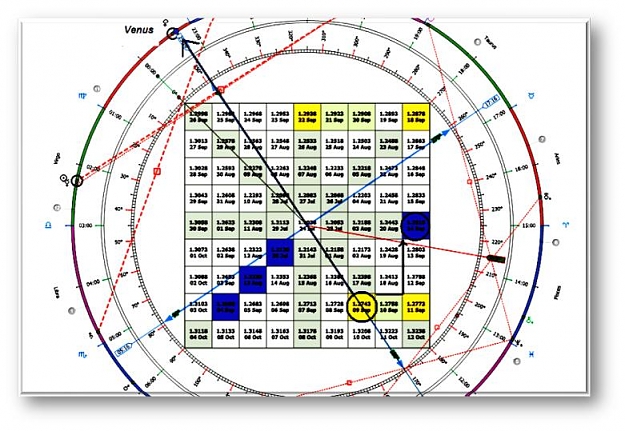
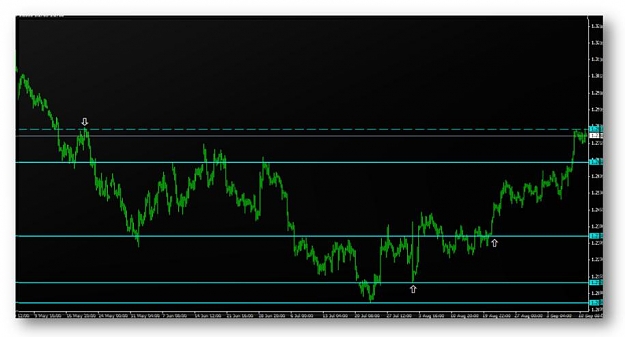
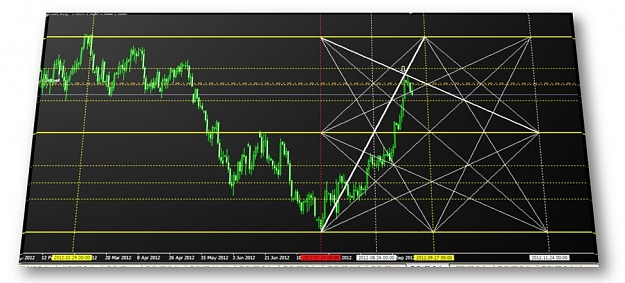
The upper square is about time. the lower is the price. The time it count as days from the beginning. Yesterday was the 40th day. On the chart below - the price "should" be 2573, but it was 2600. I get 2604 and above - 42 days. The price is two days ahead.
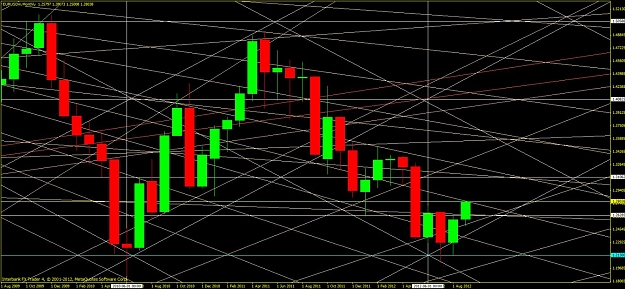
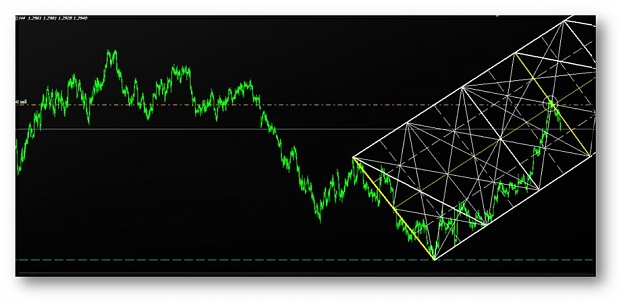
All right. Let's see those red squares. If you look there are values in the main diagonal and time and price. A 48-day price is 2695. These reds can turn direction, especially if the time and price match. But does this mean that 48 days will close at 2695?
Promised link.
http://www.forexfactory.com/showthre...54#post5928754
Attached Image (click to enlarge)
Attached Image (click to enlarge)
The upper square is about time. the lower is the price. The time it count as days from the beginning. Yesterday was the 40th day. On the chart below - the price "should" be 2573, but it was 2600. I get 2604 and above - 42 days. The price is two days ahead.
All right. Let's see those red squares. If you look there are values in the main diagonal and time and price. A 48-day price is 2695. These reds can turn direction, especially if the time and price match. But does this mean that 48 days will close at 2695?
Promised link.
http://www.forexfactory.com/showthre...54#post5928754
"You have to BE before you can DO, and DO before you can HAVE." Zig Ziglar