DislikedI am looking for views on what they feel best indicates that a move is over the market is collecting more orders for the next trend move.
EG.
Todays GU is a good example. We can see we where off to the race and shot up 50 points for it to then retrace 120% of the initial move for it to then tank off 150 pips. Now question is how can you use price action to indicate that the down move is over? I can see a fibo extension 261 and 188 from 2 different swing points on that leg. 1.5946 area is the level to buy at based on bullish momentum building...Ignored
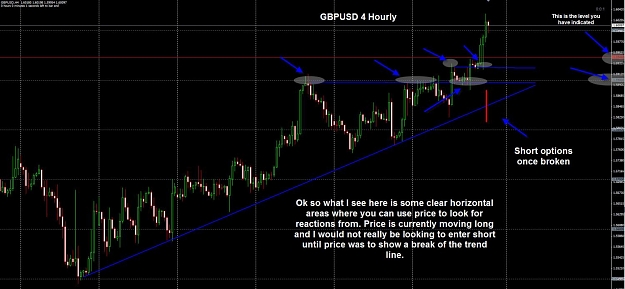
Now I am not sure on what time frame that you are watching this chart on so I can not be sure on what you are looking at on the chart.
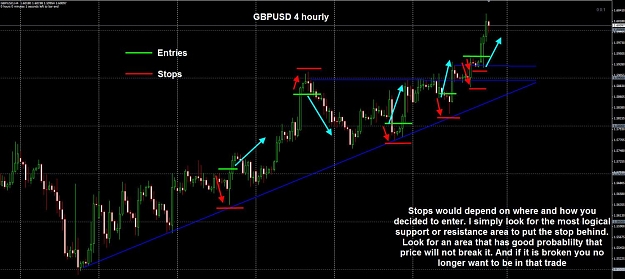
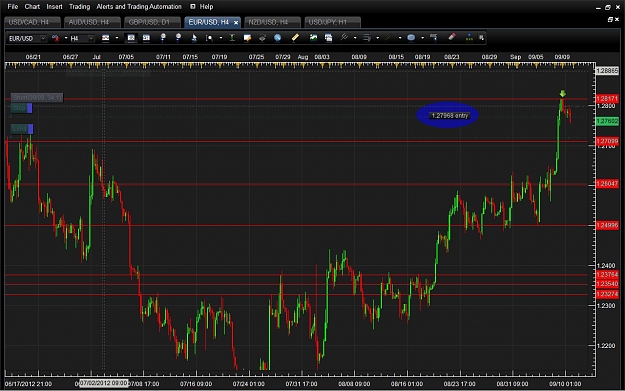
Here is a 4 hourly chart that I have put a few thoughts on. The red line is the 1.5946 is the area that you have mentioned and yes after price breaking up, pausing and then making a move further this could have been a reasonable place to be looking to take a position.
As far as when do we know the move is over. If we were to know that for sure then we would all be making a lot of $$$. I simply look for "high probability" areas or patterns that are likely to take place.
Friday was also NFP day which also could have helped with some of the market movement that was seen.
Cheers.
Attached Image (click to enlarge)
Twitter - DarkWolF@OzForexTrader - Facebook Page - link in post 1