i play sports. and all i see here is alot of shit talking. i call things as it is.
if you've nothing to contribute but shit like Davit. you should take your shit elsewhere.
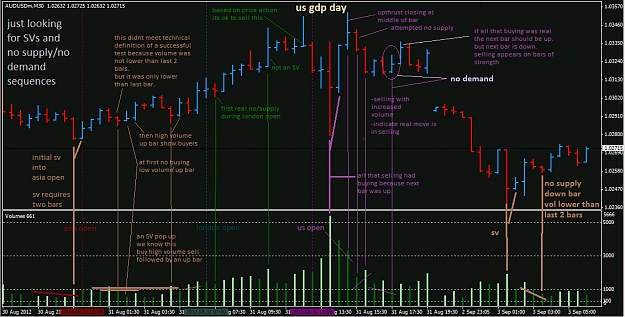
anyway. if anyone still wants to see some volume spread analysis here's 31st august EOD review. it was US GDP day but there were clues within the day's trading in AUDUSD of its direction.
Sorry about my sarcasm.Could not help it.You should not worry about this thread because I ask questions etc.
If this has merit it can easily pass criticism.
I just wanted traders specially novice traders to know that just trading Volume indi on Mq4 is not enough (otherwise prepare to hand over your money)
Understanding WHY price moves(supply and demand) and WHERE it moves ( support/resistance) is critically important.
No indi is going to show that.One must look at the charts with fresh eyes.
That's all
Ignored
Actually just having the Volume indicator on MT4 is enough. Because what we are interested in is the amount of "activity" illustrated by the Tick Volume in relation to the price.
VSA is basically Volume Spread Analysis. So we are analyzing the Volume (Activity) in relation to the Spread of a price bar.
Tom williams has a whole bunch of terminologies when it comes to VSA. Whereas Wyckoff emphasize on the phases (i.e. distribution, markup, accumulation, markdown) alongside with the 3 laws: Law of supply and demand, Law of effort vs results and Law of Cause and Effect.
In the end its more or less the same, but i kinda prefer Wyckoff's stuff cause its more straight forward.
To me in the end, its Simple Price Action where you couple it by identifying supply and demand and analyzing the volume and spread in those areas.
I find that one indicator that is overlooked is the Bill Williams Market Facilitation Index. If you do some research on this, you'd find that this indicator is extremely powerful especially when it comes to Volume spread analysis.
I trade only using the volume indicator and the BW MFI and so far its been quite consistent with very little drawdown
Ignored
If you have a chance, would you mind sharing a chart or two to illustrate what you mean?
If you have a chance, would you mind sharing a chart or two to illustrate what you mean?
Ignored
If you google Bill Williams MFI, you'd see the standard definitions and explanation of the bars. But these definitions you find online if you read it as it is, its kinda telling you what already happened hence making it lagging.
For me i use it like this, if you change your perspective of it, you'll see what i mean:
Green (MFI up, Volume up)
This is a typical candle. Why? Its like you need Petrol to drive a car, to drive uphill, u need more Petrol. Simple logic. I usually dun put much regard to this.
Brown (MFI down, Volume down)
This is also a typical candle cos similarly, no gas = car can't move. BUT in VSA terms, this can be used as a No Supply/No Demand.
Blue (MFI up, Volume down)Fake
This is the MOST POWERFUL bar. Why? Because as its defined, its a FAKE.
How can price move or have an increased spread with decreased volume? Its because that's where the Smart Money could be. So if you know where the Smart Money are, wouldn't you want to trade in their direction?
If SM was involved in this candle, we would actually see an increase in money flow. But becos its Tick Volume, and not Contracts Volume, 1 tick could mean a million contracts, it could also mean 1 contract. Make sense?
Pink (MFI down, Volume up)Squat
Bill williams states that the Squat Bar has the most potential. He's right. Cos that's where we'd see a lot of activity but lesser spread. Why? Cos SM need to off load to Retail Traders. Or simply put, someone is resisting a move. Kinda like driving your car in quick sand.
I have a bit of an issue with the blue bar though being a fake - I often see when a support or resistance level is busted & the market decides to get moving, it can cover lots of territory with little volume as there's no-one fighting the move. So yes it could mean its a fake move with SM waiting to come in and reverse it, but it could also mean the market's made up its mind & the price is free to zoom (or plummet).
|
Joined Jul 2008
|
Status: SimplePriceAction
|78 Posts
yes you are correct . that's why i said the fake depending on where it occurs can give us a big clue, its not a signal to enter . it depends on where it occurs.
if you look at wyckoff's jump over the creek or ice, its generally a push thru signalling an inbalance of supply or demand. so if you were smart money, what would you do to get the best price before the strong up/down move? if it was me, I'd "fake" a down move before marking it up, vice versa for down moves. And if you understand sam seiden's supply/demand concepts, smart money can't execute all orders at once else the move will be to big. SO, in order to execute the remaining orders, price will go back to where they last execute the initial orders. and where would that be? i.e the range of the "fake" bar cause that's where they got in at their good price before the move.
makes sense?
Section "C" would be where you'd look for low volume fake bars, and/or low spread high volume bars as evidence that big money is intent on a reversal. Alternately, if "C" had been an attempted reversal (instead of a continuation as in the above picture) and showed those kind of candles you'd know to look for the move to continue, not reverse.
So really its a question of the context in which a bar occurs as to how you interpret it from a VSA point of view. I've seen a lot of VSA analysis (on other threads/forums) that just focuses on individual candles & whether the following candle "confirms" it or not, and that never felt satisfactory to me.
yes you are correct . that's why i said the fake depending on where it occurs can give us a big clue, its not a signal to enter . it depends on where it occurs.
if you look at wyckoff's jump over the creek or ice, its generally a push thru signalling an inbalance of supply or demand. so if you were smart money, what would you do to get the best price before the strong up/down move? if it was me, I'd "fake" a down move before marking it up, vice versa for down moves. And if you understand sam seiden's supply/demand concepts, smart money can't...
Ignored
There is to much money exchanging hands in the Forex market to identify "smart money" as high volume spikes. Although I agree with your statements, I would encourage you to apply this strategy to stocks where there is central exchanges and volume is true and the playing field is level.
With central banks and large institutions balancing books and entering the market for purchases and currency exchanges, you will confuse high "volume" areas on a chart to supply and demand zones that are incorrect.
I would bet my account that if Wyckoff or Livermore were alive today they would tell you to stay the hell away from this market.
Depends where you are & how your stock market is regulated as to whether the volume is "true" and the playing field "level". Where I am in Australia, neither are the case. Big money & brokers can & do conduct large off-market transfers of shares, and there's high frequency algorithmic trading taking place within the spread seen by normal traders. I'd be highly surprised if that kind of thing isn't happening elsewhere.
If tick volume isn't useful in forex then it'll be quickly obvious, as any volume-based indicator will be nonsense & VSA analysis will be fruitless. When I look at charts I don't see that happening, indeed I see a strong correlation between volume and price movements. Sure it'd be great to have true volume (and prices!) monitored through a central exchange, but what we have is still quite useful.
Btw Livermore and Wyckoff both traded in far worse environments than today's forex. Livermore in particular began his trading career in bucket shops, and Wyckoff was tied to a tape reader, drawing charts manually and submitting orders via telephone, relying on a floor trader to execute them and paying a hefty transaction fee. I think they'd both drool over what we have now to trade with.
Here's an example of how I use the MFI to determine the area of where the Smart Money (Operators) in the supply zone. When price heads back to the supply zone for a "test", that's where I apply simple price action methods together with volume analysis to take the trade.
What I look for are rejections around that area and some consolidation in my price action analysis. When analyzing volume, I want to see volume climax followed by automatic rejection. I also look for decreased volume in UP bars. So in this attachment, where the spring occurred, you can see that volume had decreased. Now what does this tell me? It tells me that price managed to make a higher high but there wasn't volume to support it. So its like a car going up a slope but suddenly there isn't enough gas.
There is to much money exchanging hands in the Forex market to identify "smart money" as high volume spikes. Although I agree with your statements, I would encourage you to apply this strategy to stocks where there is central exchanges and volume is true and the playing field is level.
With central banks and large institutions balancing books and entering the market for purchases and currency exchanges, you will confuse high "volume" areas on a chart to supply and demand zones that are incorrect.
I would bet my account that if Wyckoff...
Ignored
To me, I'm not really concerned with the "true volume" like in stocks. I'm only interested in the amount of activity that's there. Correct me if i'm wrong, in Forex, because most if not all brokers out there(especially those with MT4), there are liquidity providers behind them, and the value of Volume for each broker will be different depending on the number of Liquidity providers and clients they have.. E.g, you'll see more volume on a single bar on FXDD or Alpari compared to that same bar on say Tadawulfx or GoMarkets.. And that's why a 1 hour bar closing on 1 broker may not be 100% the same with other brokers. However, it wouldn't deviate a lot unless during news and they are a market maker broker.
On another note, if we do have true volume with the visibility of contracts are exchanged like in stocks. Then does it mean that everyone who knows VSA has the holy grail? So VSA to me is a way of analyzing an instrument based on the "interests" or "activity" at key areas.
Btw,This is a live trade I took on the 21st August for AUDUSD.
To me, I'm not really concerned with the "true volume" like in stocks. I'm only interested in the amount of activity that's there. Correct me if i'm wrong, in Forex, because most if not all brokers out there(especially those with MT4), there are liquidity providers behind them, and the value of Volume for each broker will be different depending on the number of Liquidity providers and clients they...
Ignored
I agree on some points. To get the best overall gauge of volume you must use esignal or sierra charts. Seirra pulls from the single biggest retail provider and if memory serves me correct, I think esignal pulls from over 300 providers, therefore costing the most.
i play sports. and all i see here is alot of shit talking. i call things as it is.
if you've nothing to contribute but shit like Davit. you should take your shit elsewhere.
anyway. if anyone still wants to see some volume spread analysis here's 31st august EOD review. it was US GDP day but there were clues within the day's trading in AUDUSD of its direction.
Hi Nico, have some question on the terms mentioned on the chart posted:
- what does SV implies?
- no supply refers to no Sellers?
- no demand refers to no Buyers?
- on live trading where exactly would be the trade entry?
I'm just moving clouds today - tomorrow I'll try mountains.
EOD is one thing.
how bout when its live and jumping.
i like it live and jumping.
it tests my emotions. my gameplan. my everything.
are you ready?
LO has begun.
Hi Nico, have some question on the terms mentioned on the chart posted:
- what does SV implies?
- no supply refers to no Sellers?
- no demand refers to no Buyers?
- on live trading where exactly would be the trade entry?
Ignored
i look to enter after the nosupply/nodemand bar closes.
using the last swing low(usually the SV) area as the stop.
my stop loss is at least 30pips.
the idea behind all of this(at least for me) is finding the tipping point in the supply and demand seesaw.
the point where smart money has tested that there is no one left to get in their way.
awsl: SV means "stopping volume", where a trend hits an area of resistance or support that stops it in its tracks despite a high volume effort to keep going. Often associated with a trend's "climax" where it gets totally carried away & runs hard (and then ends).
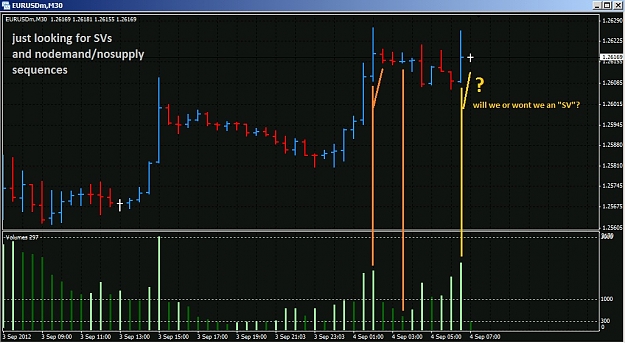
Nico: Its a bit hard to interpret the final EU candle as it was right before Frankfurt opened. There'll be a natural increase in volume now and we'll get the shenanigans that happen when any market opens, similar to when news is released.
|
Joined Jul 2008
|
Status: SimplePriceAction
|78 Posts
Attached Image (click to enlarge)
Attached Image (click to enlarge)
Here's my analysis on EU on a smaller time frame.
EU 15min shows a pin bar rejection at resistance.
EU 5min illustrate the formation of the 15min pin bar.
I see that an inside UP bar was formed and had a higher close than previous bar but it had Lower Volume. MFI shows paints blue. Next bar after that is a big down bar which made a higher high but closed lower(Spring action) with increased volume. This tells me that the Blue MFI bar is a "Fake" and that's where the Operators are.
Price now goes back to the range of the "Fake" bar and I took a short there. So i'd see how this works out for me. Hopefully i'm not wrong
I can see fake/SV moves in each direction. Combined with the start of the Frankfurt session & London imminent I'd prefer to wait for the market to make up its mind.