Remaining in the spirit of the Strategy
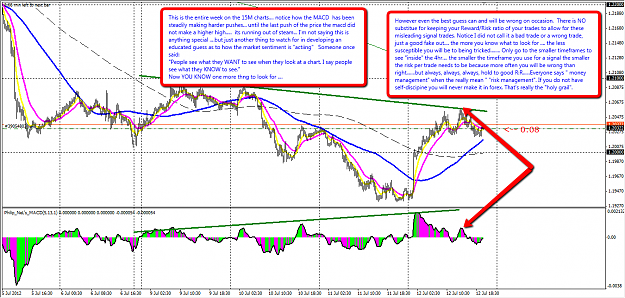
Market Rhythm
SEE WHAT EVENTUALLY HAPPENED
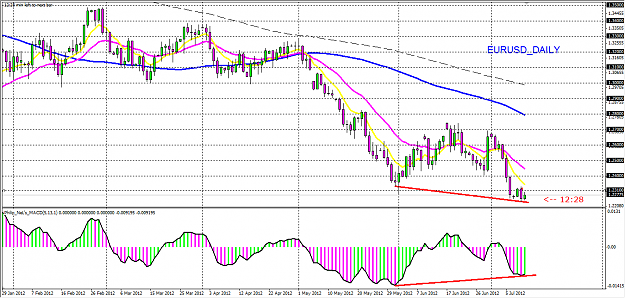
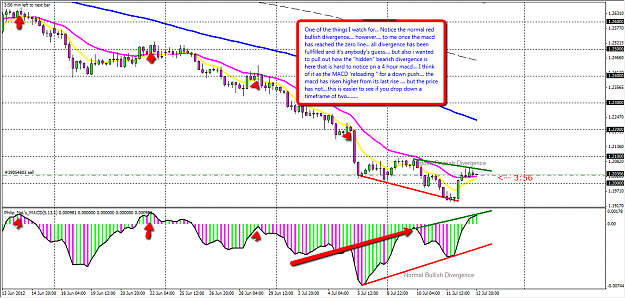
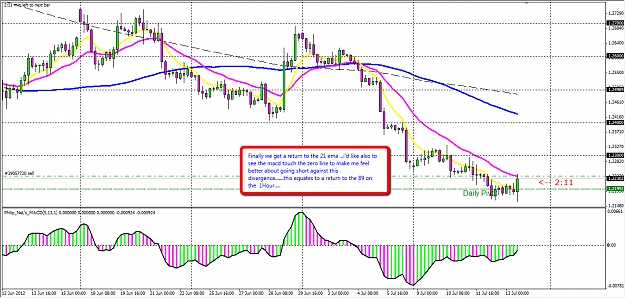
The original analysis for the trade still hold; the up move was still valid as anticipated. The MACD Divergence setup still prevailed in both the 4Hour and 1Hour time frames.
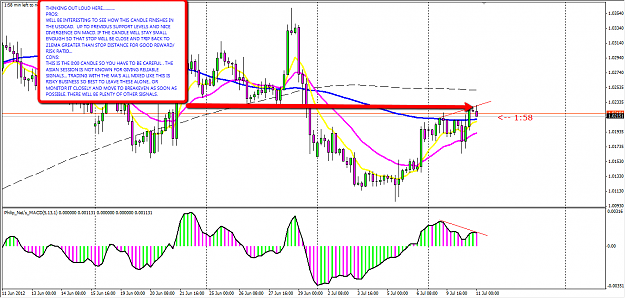
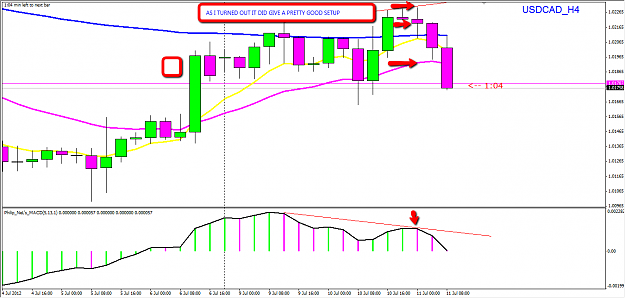
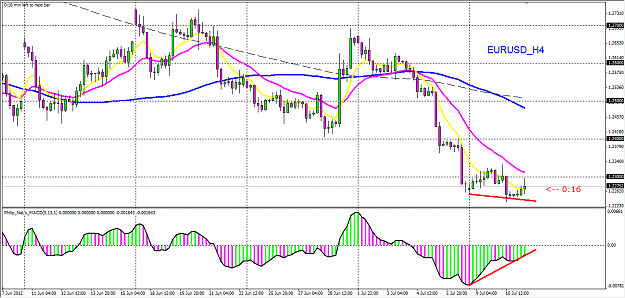
Inset A: The 4 Hour chart; the pin bar or tail on the bottom trendline or channel (the small circle) and the little hanging man forming an inside bar or candle confirmed the up move...Also price has found support 3 times on that bottom channel or trendline; this could also be regarded as a new signal on its own where entry is at the close of the tail moving away from the trendline-the small circle.
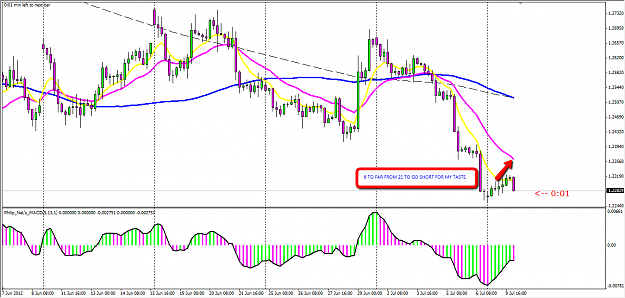
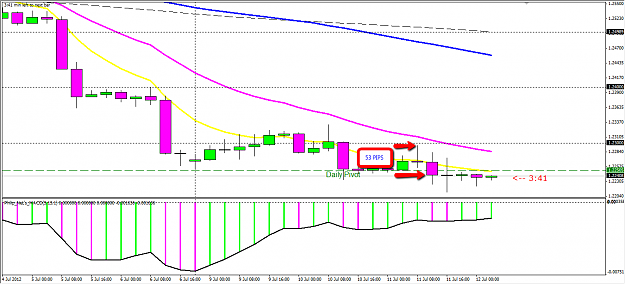
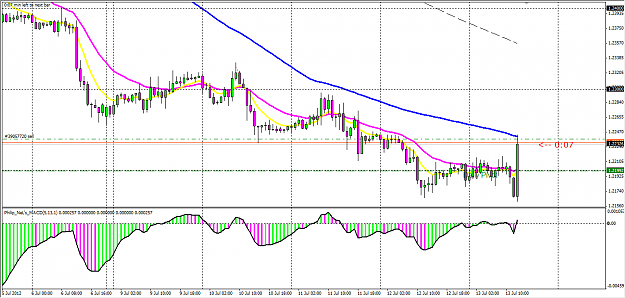
Inset B: Market Emotion; This is the 1 Hour chart. Price has found support 3 times on same bottom channel as in the 4Hour with beautiful mutiple tails on each of the support points, that is buy pressure; they are pushing the market or price upwards. Also at the 3rd support point, the small circle; with that tail and a strong bullish candle, price went back into the 2nd Shoulder...just as always, confluence between the two charts or scenarios-the 4-Hour and 1-Hour time frames...
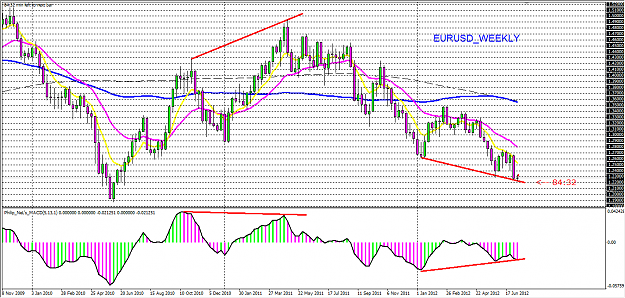
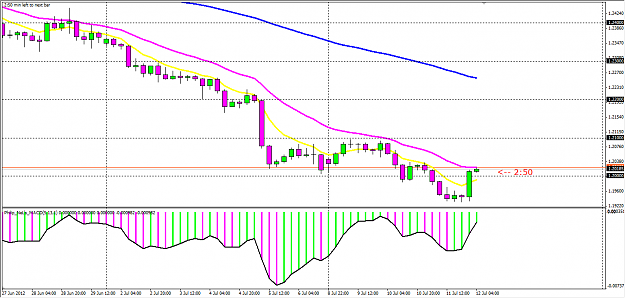
Inset C: Just to show the corrlation between the two pairs;EUR/USD and GBP/USD.
God Bless Phillip!