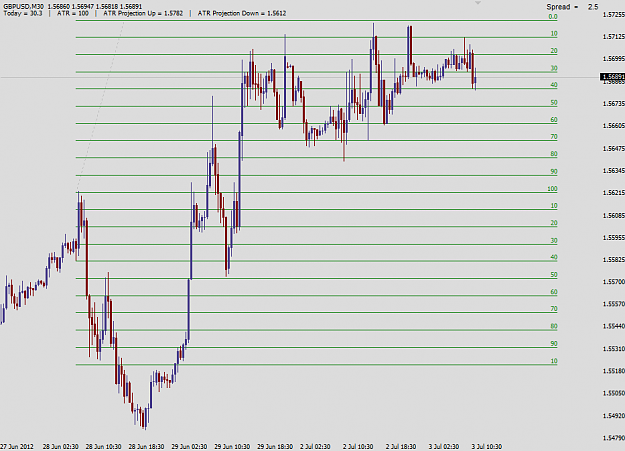
I have edited the fib tool values from 0 to 1 with an increment of .1 in between and simply labelled each from 0 to 100 of an increment of 10. I then stretched the fib tool across 100 pips on the chart. This acts as a 'pip grid' as each level represents a 10 pip increment.
I have done this so I can simply and quickly see the price movement/range on current frame I am viewing. 10 pip increments is a good one for me.
In my feeble attempt.. I wanted to know if a 'pip grid' can be created by an indicator that fills the whole chart with 10 pip levels? I know this is similar to the sweetspot indicator but the problem with that is when you double click on the chart you often accidentally select a horizontal line and can make a mess. This is why I have used the fib tool - nothing happens when you click the levels.
Here is my example with (0 to 100) + another (0 to 100).
..
Attached Image (click to enlarge)