emmanuel
Good info, but seems like a lot to consider for some of the newer traders.
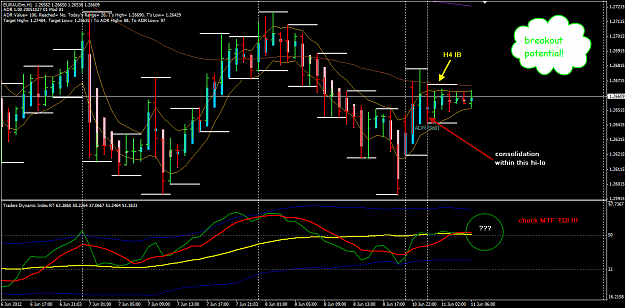
Here's a hint that might simplify - the TDI will show change in bias when the RSI crosses the MBL from either the overbought or oversold areas -notice this is his videos. You can also observe divergence, again notice in the videos.
In my experience, this is much easier to observe than trying to track the bias by drawing trend lines.
Just trying to take some of the additional input/chart clutter out of the equation.
all the best.
dcginc
QuoteDislikedhere is a good video to watch in case you do not have this in your email yet.
http://www.compassfx.com/video/ip/60712/60712.html
Good info, but seems like a lot to consider for some of the newer traders.
Here's a hint that might simplify - the TDI will show change in bias when the RSI crosses the MBL from either the overbought or oversold areas -notice this is his videos. You can also observe divergence, again notice in the videos.
In my experience, this is much easier to observe than trying to track the bias by drawing trend lines.
Just trying to take some of the additional input/chart clutter out of the equation.
all the best.
dcginc