Here is some code to get the juices flowing for some of you who aren't that familiar with R. I hope it will inspire some of you who are unfamiliar with R to play with some of the packages and do your own analysis. Assume a price series AUDUSD, NZDUSD in data frame df.
You can also perform the linear regression without intercept like: m <- lm(y~x+0)
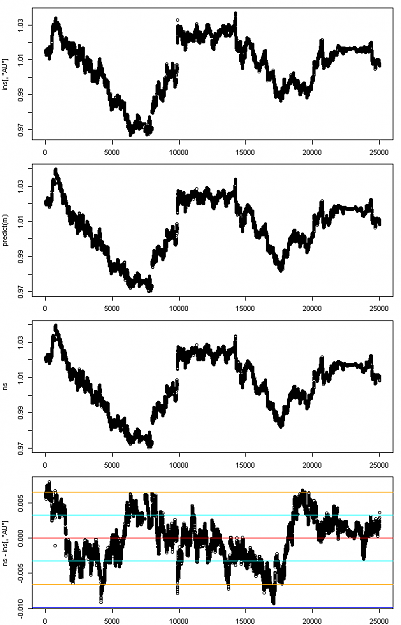
Plot the new series and compare to manually working out the coefficients:
Note how similar the #1 plot looks to the #2 plot. But you can see small discrepencies like the shape of the first bottom. Just in case you don't believe me this is the manual formula for the predicted AU price and it should be identical to plot #2:
And finally, the thing you've been waiting for - the spread between the two. I'll take my predicted or calculated AU price made up from NU and subtract the real AU from it and plot mean and standard deviation lines on the 4th chart.
Inserted Code
df <- data.frame(x)
# perform the regression (get NU to predict AU)
m <- lm(AU~NU,data=df)
# plot a line chart of the residuals to visually check for cointegration
plot(resid(m), type='l')
coef(m)
Inserted Code
(Intercept)          NU
 0.03141752  1.27344033
You can also perform the linear regression without intercept like: m <- lm(y~x+0)
Plot the new series and compare to manually working out the coefficients:
Inserted Code
# format for maximum graph space, minimum borders
par(mar=c(2,4,1,1))
# plot 4 charts  one on top of the other for comparison
par(mfrow=c(4,1))
plot(ins[,'AU']) # first plot AU for comparison purposes
# plot the predicted series for AU - this is made up from NU * 1.27344... + 0.0314...
plot(predict(m))
Inserted Code
ns <- df[,'NU']*coef(m)[[2]]+coef(m)[[1]]
plot(ns) # 3rd plot
And finally, the thing you've been waiting for - the spread between the two. I'll take my predicted or calculated AU price made up from NU and subtract the real AU from it and plot mean and standard deviation lines on the 4th chart.
Inserted Code
plot(ns-ins[,'AU'])
s = sd(ns-ins[,'AU'])
mn = mean(ns-ins[,'AU'])
abline(a=mn,b=0,col='red')
abline(a=mn+s,b=0,col='cyan')
abline(a=mn-s,b=0,col='cyan')
abline(a=mn-s*2,b=0,col='orange')
abline(a=mn+s*2,b=0,col='orange')
abline(a=mn+s*3,b=0,col='blue')
abline(a=mn-s*3,b=0,col='blue')