I also noticed that it will not allow the arrows/signals to be displayed on one time frame only. If I change it to show on specific time frames, it will still show on all. Hopefully you can change that as well.
Ignored
Sorry Kas - not sure what you are after here. As it is, the indicator calculates the swings on the timeframe displayed on the chart. So, as soon as you change timeframe the indicator recalculates and draws the swings relative to the current timeframe. It does not draw daily arrows on the 4hr for example...perhaps you could explain in greater detail?
Sorry Kas - not sure what you are after here. As it is, the indicator calculates the swings on the timeframe displayed on the chart. So, as soon as you change timeframe the indicator recalculates and draws the swings relative to the current timeframe. It does not draw daily arrows on the 4hr for example...perhaps you could explain in greater detail?
Cheers
Ignored
What I mean is if I click on the indicator and go into visualization and change it so it does not display on all time frames, it will still show on all time frames. I would like to be able to show arrows on 1 time frame only. So when I go to another time frame they should not be displayed. Hope that makes sence.
What I mean is if I click on the indicator and go into visualization and change it so it does not display on all time frames, it will still show on all time frames. I would like to be able to show arrows on 1 time frame only. So when I go to another time frame they should not be displayed. Hope that makes sence.
Ignored
OK. I will include an option in user settings to allow you to switch off arrows. That way, you can do what you want with them in the timeframe that you are interested in, and then switch them off when you change timeframe.
I will also change the logic to draw the arrows on the signal bar when it is lower/higher than the bars within the look back window as per one of your earlier posts.
You also mentioned support and resistance lines - I can include those too, but after that I will be moving on to some other projects.
It should do most of the things that you want by then though...
OK. I will include an option in user settings to allow you to switch off arrows. That way, you can do what you want with them in the timeframe that you are interested in, and then switch them off when you change timeframe.
I will also change the logic to draw the arrows on the signal bar when it is lower/higher than the bars within the look back window as per one of your earlier posts.
You also mentioned support and resistance lines - I can include those too, but after that I will be moving on to some other projects.
It should do most of the...
Ignored
Thanks. If you could make post #33 a priority over adding s/r lines, that would be great.
Joined Jul 2009
|
Status: ...or there about!
|220 Posts
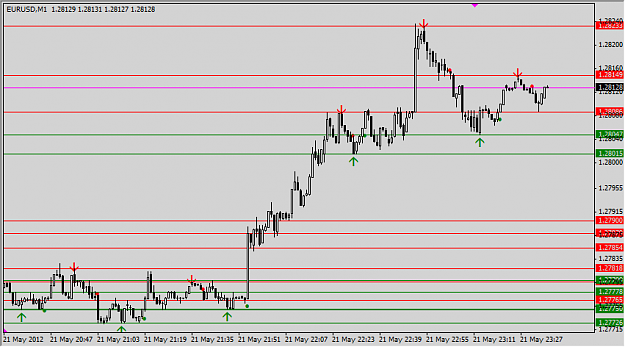
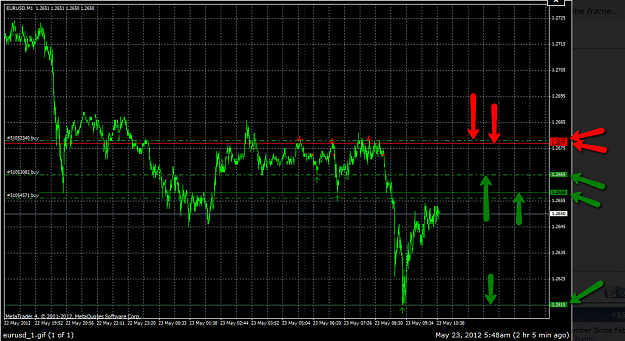
Here is the new version Kas:
Attached Image (click to enlarge)
Revisions:
Changed the method of calculating arrow spacing;
Added option to show S/R lines;
Fixed the redrawing issue;
Added option to hide the arrows, lines, etc,.
That's me done on this now - unless you find any bugs!
In the image above, I used a window size of 10 - quite interesting watching on the M1...hope you find it useful.
I attached the file but nothing appears in the chart posted, can you help me?
Ignored
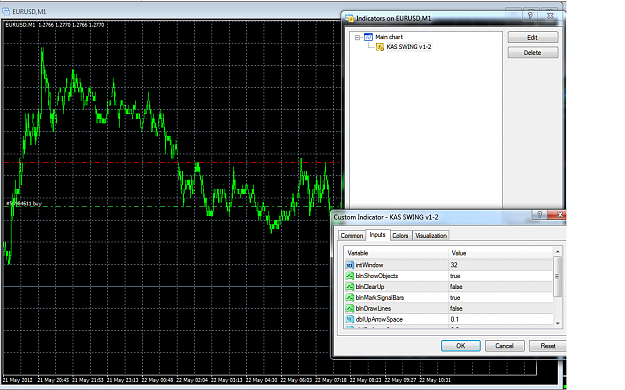
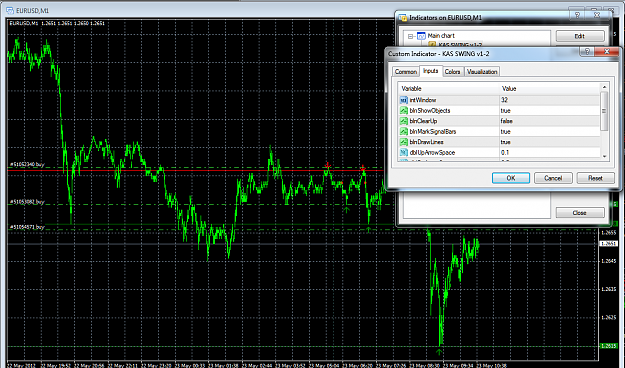
Set the user input - blnDrawLines to true to display the support resistance lines
EDIT: Ignore the following:- As you are using a 4 digit broker, you will need to change the values in the dblUpArrowSpace and dblDownArrowSpace in order to see the arrows. Have a look in the object list and have a look at one of the arrows price value - that should give you an idea of how much to adjust the values by.
I checked and I have already allowed for different brokers. Next question. Did you apply the indicator to the M1 chart, or a higher time frame before dropping down? If the later, you may find that the bar does not exist on your M1 chart. Try deleting the indicator (you must set the blnClearUp input to true before deleting) then load it onto the M1 chart, or whichever chart you are interested in....
Set the user input - blnDrawLines to true to display the support resistance lines
EDIT: Ignore the following:- As you are using a 4 digit broker, you will need to change the values in the dblUpArrowSpace and dblDownArrowSpace in order to see the arrows. Have a look in the object list and have a look at one of the arrows price value - that should give you an idea of how much to adjust the values by.
I checked and I have already allowed for different brokers. Next question. Did you apply the indicator to the M1 chart, or a higher time frame...
Ignored
I made everything you said
I put all the settings and chart.
maybe if you have time you can help
thanks
Set the user input - blnDrawLines to true to display the support resistance lines
EDIT: Ignore the following:- As you are using a 4 digit broker, you will need to change the values in the dblUpArrowSpace and dblDownArrowSpace in order to see the arrows. Have a look in the object list and have a look at one of the arrows price value - that should give you an idea of how much to adjust the values by.
I checked and I have already allowed for different brokers. Next question. Did you apply the indicator to the M1 chart, or a higher time frame...
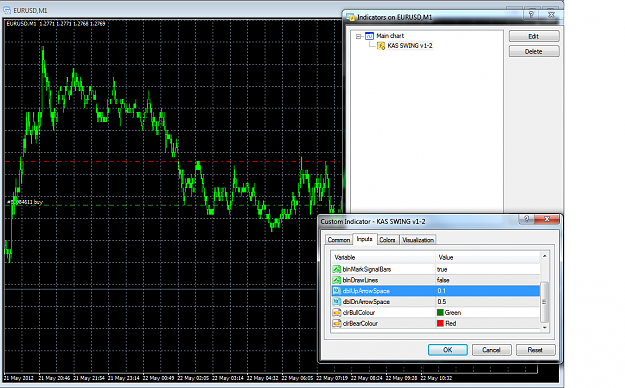
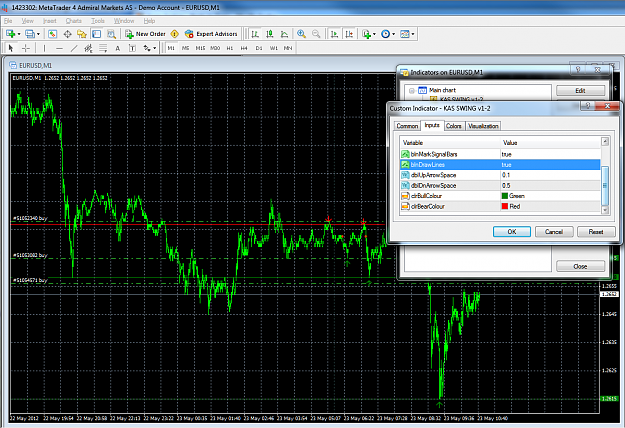
On closer inspection - the indicator is working correctly. I have marked where it has drawn the lines on your chart in the image below:
Attached Image (click to enlarge)
By coincidence, some of your order lines are in the same locations as the lines. By default, the indicator draws the support/resistance lines in the background - so behind your order lines!
I hope that the above and previous video answers your questions?...
By coincidence, some of your order lines are in the same locations as the lines. By default, the indicator draws the support/resistance lines in the background - so behind your order lines!
I hope that the above and previous video answers your questions?...
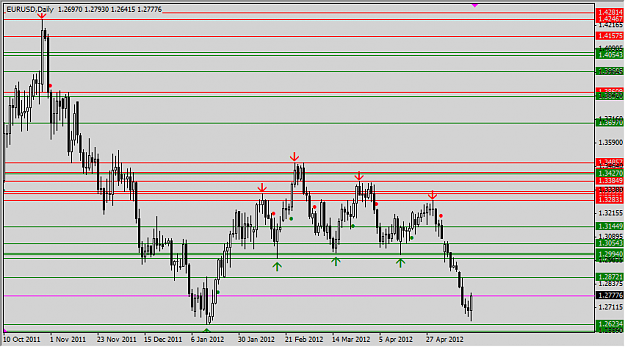
1. Able to show higher time frame support and resistance on lower time frame. e.g. Weekly support and resistance displayed on Daily and lower time frames.