Hi Guys...
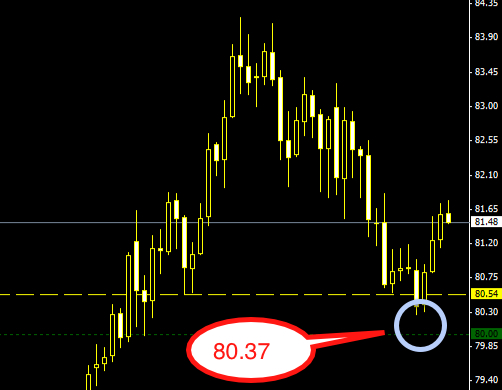
Monthly - Feb. candle was showing strong bullish but march candle is week bearish bar with long wicks which means bullish trend is over.price is below 200Ema.And also at strong monthly support.
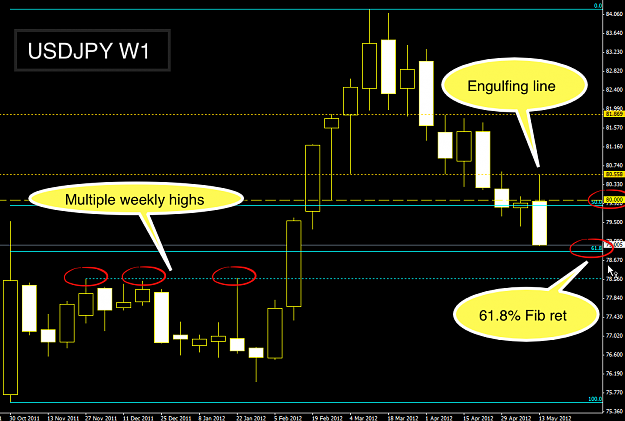
Weekly - last week was inside bar.price is above 200ema which is opposite to previous monthly analysis so there should be correction.
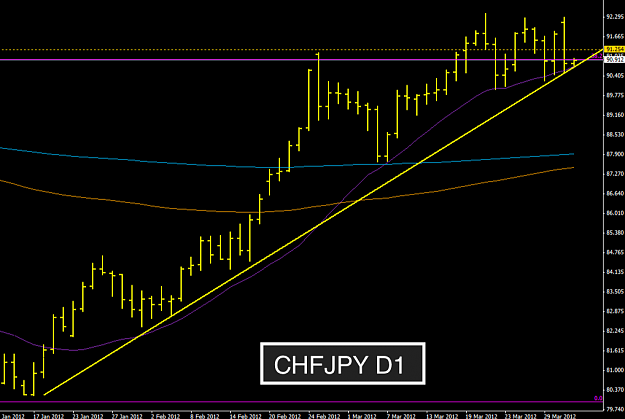
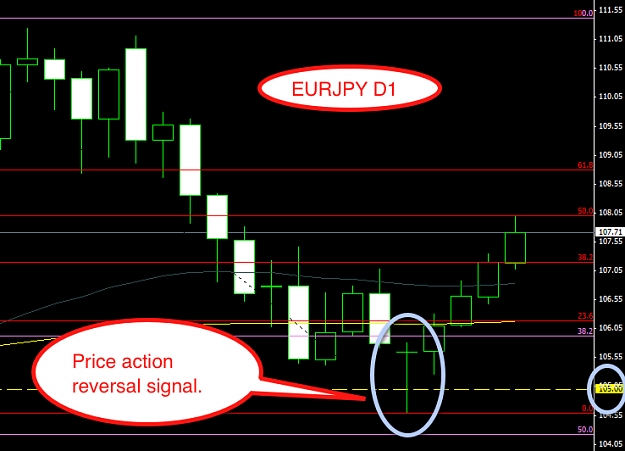
Daily -nice 1-2-3 formation and also price is above 200ema which needed correction.
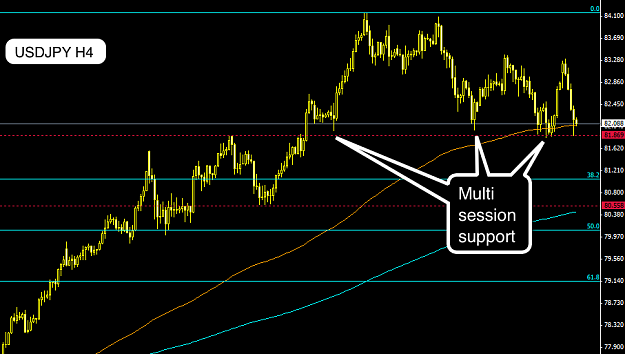
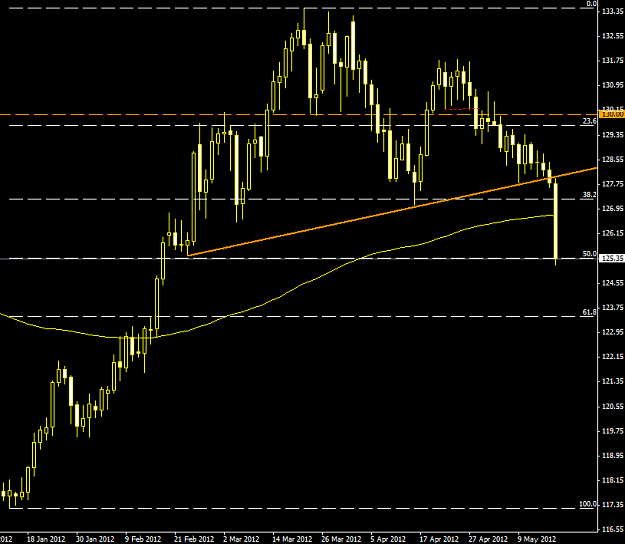
4h -price is above 200ema and is going to break 200ema downward nice flying Buddha formation.
my hindsight is downward.
Suggestions are most welcome.
Monthly - Feb. candle was showing strong bullish but march candle is week bearish bar with long wicks which means bullish trend is over.price is below 200Ema.And also at strong monthly support.
Weekly - last week was inside bar.price is above 200ema which is opposite to previous monthly analysis so there should be correction.
Daily -nice 1-2-3 formation and also price is above 200ema which needed correction.
4h -price is above 200ema and is going to break 200ema downward nice flying Buddha formation.
my hindsight is downward.
Suggestions are most welcome.
I am a hunter...i kill both bulls and bears...