Ok...one more very important thing,
DO NOT BUY IN SELL ZONES
DO NOT SELL IN BUY ZONES.
if you are using the template that I have supplied, there are buy and sell zones (called auto fib trade zones in the indicator list)
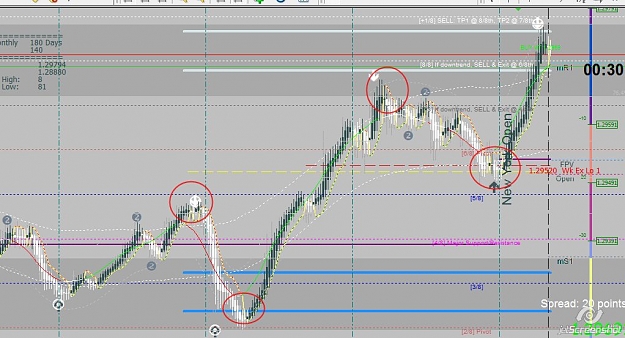
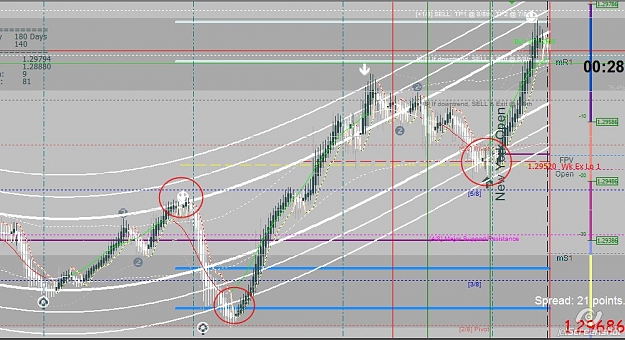
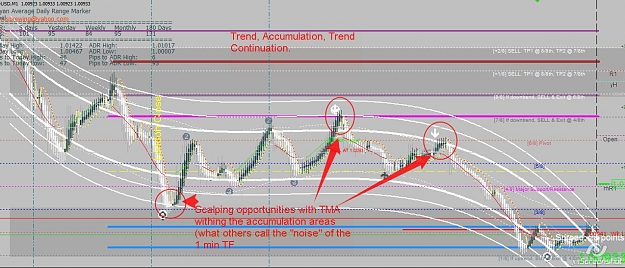
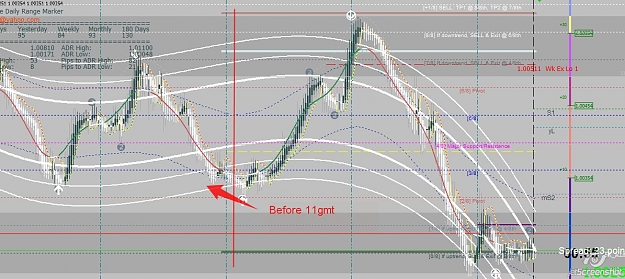
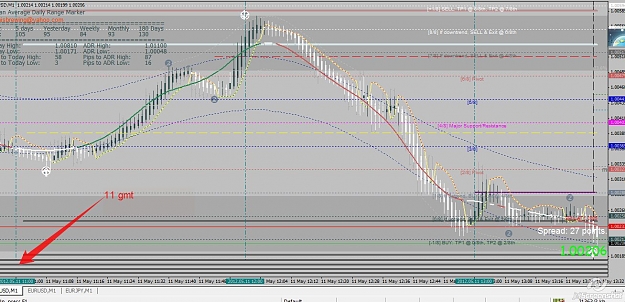
1.If price action is in these areas, watch for accumulation.
2. if price was in these areas, and bounces out, there maybe a trade IF price action follows the rules. (Come out of TMA, hit extreme CoG area)
3. This indicator uses Fibonacci calculations and bases its information off the last 300 periods. You may adjust it to 500 if you feel that it may be more accurate to include the last trend information. I am more comfortable with 300. But test it out. If you are the type of trader who feels better with a steadfast indy, then a longer period would serve you better.....me? I'm just a tick. I go where the elephant takes me.
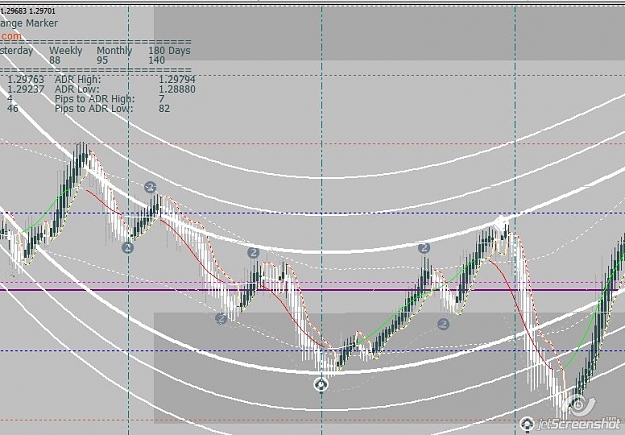
4. Since this indy uses fib calculations for the last high and low, it will adjust itself accordingly. If price makes a new high and low within the period specified, the grey area will extend to display new high or low. This has to happen in order for it to remain accurate.
Like I said before, each TF has its limitations as far as how PA cycles. The zones help identify those areas where price is most likely to reverse. It is best to think of those areas as overbought and oversold areas. And just like any RSI or QQE, just because it is implied that product is overbought and oversold it doesn't mean that it actually overbought or oversold.

Get familiar with these zones....they have saved me a lot of heart ache and pips! Hopefully, they will give you a better reading of what PA is doing.
So now begs the question: Can I stay in the trade from one zone to the other? The answer is ABSOLUTELY! I prefer to take the swings but to each his own.

DO NOT BUY IN SELL ZONES
DO NOT SELL IN BUY ZONES.
if you are using the template that I have supplied, there are buy and sell zones (called auto fib trade zones in the indicator list)
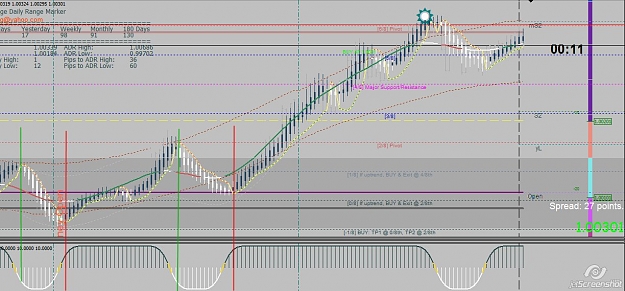
1.If price action is in these areas, watch for accumulation.
2. if price was in these areas, and bounces out, there maybe a trade IF price action follows the rules. (Come out of TMA, hit extreme CoG area)
3. This indicator uses Fibonacci calculations and bases its information off the last 300 periods. You may adjust it to 500 if you feel that it may be more accurate to include the last trend information. I am more comfortable with 300. But test it out. If you are the type of trader who feels better with a steadfast indy, then a longer period would serve you better.....me? I'm just a tick.
4. Since this indy uses fib calculations for the last high and low, it will adjust itself accordingly. If price makes a new high and low within the period specified, the grey area will extend to display new high or low. This has to happen in order for it to remain accurate.
Like I said before, each TF has its limitations as far as how PA cycles. The zones help identify those areas where price is most likely to reverse. It is best to think of those areas as overbought and oversold areas. And just like any RSI or QQE, just because it is implied that product is overbought and oversold it doesn't mean that it actually overbought or oversold.
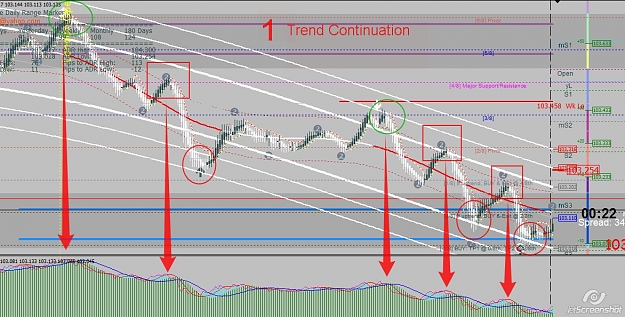
Attached Image (click to enlarge)
Get familiar with these zones....they have saved me a lot of heart ache and pips! Hopefully, they will give you a better reading of what PA is doing.
So now begs the question: Can I stay in the trade from one zone to the other? The answer is ABSOLUTELY! I prefer to take the swings but to each his own.
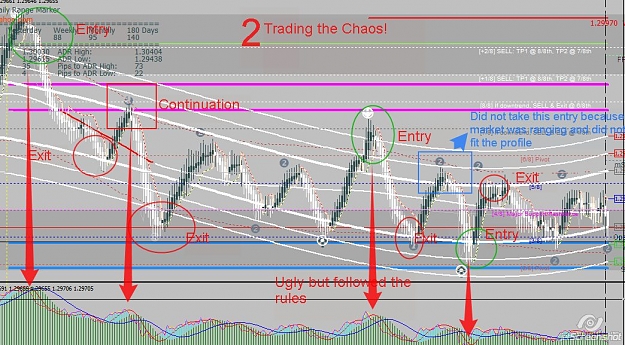
Attached Image (click to enlarge)
1