Both, but they are not from this new strategy I'm following, what I call 'FXCube-MTFA-CCI+rbetancor-MTF-MM'
They are old one from my old strategies, still open, because as I'm managing the account now I hope to recover them and not 'from them'
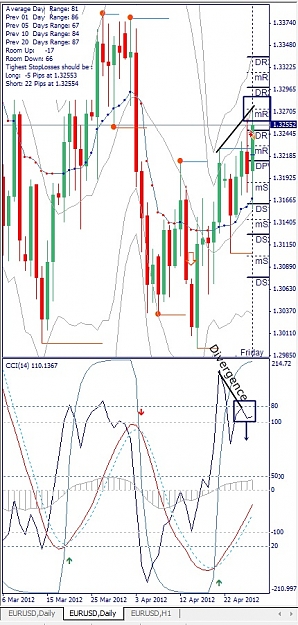
I do understand D1 chart is not the same due to difference broker. However, my broker (FXPro) seems vary from yours (in terms of CCI).
My chart cant see the CCI divergence #1341. Is it normal?
Ignored
Hi sam2vt!
I would opt a broker which fits best for me.
I'm discontend with all brokers, but FXPro is real bullsh*t!
Aren't you feeling uneasy with them?
FXcube
Joined Oct 2008
|
Status: Sailing for pips
|2,099 Posts
Slow week didn't hit goal of 1.5% a day but is was a funky week and I didn't get in as much screen time as I would like 80% win stinks too was experimenting.
Account up over 300% since 01-20-2012 Can't complain too much and equity is getting back to a comfortable zone
Hi sam2vt!
I would opt a broker which fits best for me.
I'm discontend with all brokers, but FXPro is real bullsh*t!
Aren't you feeling uneasy with them?
FXcube
Ignored
Which broker fits best for you? I would like to get the same chart screen as you which easier when checking on it especially on higher TF.
Thanks for your help.
Best regards
Sam
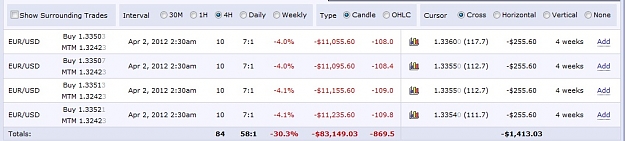
How much was your Floating yesterday and two days ago (actual: -3'455.38$)?
Ignored
Yesterday AVG: -3.200€
Wensday AVG: -3.000€
Yesterday gains was: 264$ 3.63%
Today gains (been out since this morning posts): 703$ 9.64%
This week gains: 1131.80€ 17.99%
Floating DD is not from this strategy ... they are a 1.0 Lot sell @1.3040 -1700€, and others ops alone from other systems, real DD from this strategy is under -380€, so it's ok as far as I gain more than 50$/day and I think that I'm doing ok
Ignored
The percentage of drawdown shouldn't be important if you could manage it with LOM in a right way.
After 10 days I should have make appreciate the profit of the maximum possible drawdown on an average. (300 X 10 = 3'000.-$).
At the Demo Account I manage with LOM some open orders since 2012 April 02 (see #1356) above all carry trades.
One step at a time! Haste makes waste.
I wish you green pips!
FXcube
Often in life, the right action is the hardest to take. The same dynamic occurs in trading. For most traders it is extremely difficult to buy tops and sell bottoms, because from a very early age we are conditioned to look for value and buy "cheap," while selling "dear." This is why, although most traders proclaim their love for trading with the trend, in reality, the majority love to pick tops or bottoms. While these types of "turn" trades can be very profitable, turn trading can sometimes seem like a Sisyphean task, as price trends relentlessly in one direction, constantly stopping out the bottom and top pickers.
Most traders are reluctant to buy breakouts, for fear of being the last one to the party before prices reverse with a vengeance. So, how can they learn to trade breakouts confidently and successfully? The "do the right thing" setup is designed to deal with just such a predicament. It tells the trader to buy or sell when most ingrained lessons are against doing so. Furthermore, it puts the trader on the right side of the trend, at the times when many other traders are trying to fade the price action. Read on as we cover this strategy and show you some examples of how it can be used.
Do the Right Thing In the "do the right thing" strategy, the capitulation of top and bottom pickers in the face of a massive buildup of momentum, forces a covering of positions, allowing you to exit profitably within a very short period of time after putting on a trade.
"Do the right thing" employs a rarely used indicator in FX called the commodity channel index (CCI), which was invented by Donald Lambert in 1980 and was originally designed to solve engineering problems regarding signals. The primary focus of CCI is to measure the deviation of the price of the currency pair from its statistical average. As such, CCI is an extremely good and sensitive measure of momentum and helps us to optimize only the highest probability entries for our setup. (For background reading, see Timing Trades With The Commodity Channel Index.)
Without resorting to the mathematics of the indicator, please note that CCI is an unbound oscillator, with a reading of +100 typically considered to be overbought and any reading of -100 considered oversold. For our purposes, however, we will use these levels as our trigger points, as we put a twist on the traditional interpretation of CCI. We actually look to buy if the currency pair makes a new high above 100 and sell if the currency pair makes a new low below -100. In "do the right thing" we are looking for new peaks or spikes in momentum that are likely to carry the currency pair higher or lower. The thesis behind this setup is that, much like a body in motion will remain so until it's slowed by counter forces, new highs or lows in CCI will propel the currency farther in the direction of the move, before new prices finally put a halt to the advance or the decline.
Rules for the Long Trade
1. On the daily or the hourly charts, place the CCI indicator with standard input of 20.
2. Note the very last time the CCI registered a reading of greater than +100 before dropping back below the +100 zone.
3. Take a measure of the peak CCI reading and record it.
4. If CCI once again trades above the +100 and if its value exceeds the prior peak reading, go long at market at the close of the candle.
5. Measure the low of the candle and use it as your stop.
6. If the position moves in your favor by the amount of your original stop, sell half and move the stop to breakeven.
7. Take profit on the rest of the trade when the position moves to two times your stop.
Rules for the Short Trade
1. On the daily or the hourly charts, place the CCI indicator with standard input of 20.
2. Note the very last time the CCI registered a reading of less than -100 before poking above the -100 zone.
3. Take a measure of the peak CCI reading and record it.
4. If CCI once again trades below the -100 and if its value exceeds the prior low reading, go short at market at the close of the candle.
5. Measure the high of the candle and use it as your stop.
6. If the position moves in your favor by the amount of your original stop, sell half and move the stop on the remainder of the position to breakeven.
7. Take profit on the rest of the trade when position moves to two times your stop.
CCI Setup On Longer Time Frames In the daily chart of the EUR/USD pair (Figure 1) we see that the former peak high above the CCI +100 level was recorded on Sept. 5, 2005, when it reached a reading of 130. Not until more than three months later on Dec. 13, 2005, did the CCI produce a value that would exceed this number.
Throughout this time, we can see that EUR/USD was in a severe decline with many false breakouts to the upside, that fizzled as soon as they appeared on the chart. On Dec. 13, 2005, however, CCI hit 162.61 and we immediately went long on the close at 1.194,5 using the low of the candle at 1.1906 as our stop. Our first target was 100% of our risk, or approximately 40 points. We exited half the position at 1.1985 and the second half of the position at two times our risk at 1.2035. Our total reward-to-risk ratio on this trade was 1.5:1, which means that if we are only 50% accurate, the setup would still have positive expectancy. Note also that we were able to capture our gains in less than 24 hours, as the momentum of the move carried our position to profit very quickly.
For traders who do not like to wait nearly a quarter of a year between setups, the hourly chart offers far more opportunities for the "do the right thing" setup. It is still infrequent, which is one of the reasons that makes this setup so powerful; the common wisdom in trading is "the rarer the trade, the better the trade." Nevertheless, it occurs on the hourly charts far more often than on the dailies.
In Figure 2, we look at the hourly chart of the EUR/USD between March 24 and March 28 of 2006. At 1 p.m. on March 24, the EUR/USD reaches a CCI peak of 142.96. Several days later at 4 a.m. on March 28, the CCI reading reaches a new high of 184.72. We go long at market on the close of the candle at 1.2063. The low of the candle is 1.2027 and we set our stop there.
The pair consolidates for several hours and then makes a burst to our first target of 1.2103 at 9 a.m. on March 28. We move the stop to breakeven to protect our profits and are stopped out a few hours later, banking 40 pips of profit. As the saying goes, half a loaf is better than none, and it is amazing how they can add up to a whole bakery full of profits, if we simply take what the market gives us.
CCI Setup On Shorter Time Frames Figure 3 shows a short in the USD/CHF. This example is the opposite of the approach shown above. On Oct. 11, 2004, USD/CHF makes a CCI low of -131.05. A few days later, on Oct.14, the CCI prints at -133.68. We enter short at market on the close of the candle at 1.2445. Our stop is the high of that candle at 1.2545. Our first exit is hit just two days later at 1.2345. We stay in the trade with the rest of the position and move the stop to breakeven. Our second target is hit on Oct. 19, no more than five days after we've entered the trade.
The total profit on the trade? 300 points. Our total risk was only 200 points, and we never even experienced any serious drawdown, as the momentum pulled prices farther down. The key is high probability, and that is exactly what the "do the right thing" setup provides.
Figure 4 shows another example of a short-term trade, this time to the downside in the EUR/JPY. At 9 p.m. on March 21, 2006, EUR/JPY recorded a reading of -115.19 before recovering above the -100 CCI zone. The "do the right thing" setup triggered almost perfectly five days later, at 8 p.m. on March 26. The CCI value reached a low of -133.68 and we went short on the close of the candle. This was a very large candle on the hourly charts, and we had to risk 74 points as our entry was 140.79 and our stop was at 141.51.
Many traders would have been afraid to enter short at that time, thinking that most of the selling had been done, but we had faith in our strategy and followed the setup. Prices then consolidated a bit and trended lower until 1 p.m. on March 27. Less than 24 hours later we were able to hit our first target, which was a very substantial 74 points. Again we moved our stop to breakeven. The pair proceeded to bottom out and rally, taking us out at breakeven. Although we did not achieve our second target overall, it was a good trade as we banked 74 points, without ever really being in a significant drawdown.
When "Do the Right Thing" Does You Wrong
Figure 5 shows how this setup can go wrong and why it is critical to always use stops. The "do the right thing" setup relies on momentum to generate profits. When the momentum fails to materialize, it signals that a turn may be in the making. Here is how it played out on the hourly charts in AUD/USD. We note that CCI makes a near-term peak at 132.58 at 10 p.m. on May 2, 2006. A few days later at 11 a.m. on May 4, CCI reaches 149.44, prompting a long entry at .7721. The stop is placed at .7709 and is taken out the very same hour. Notice that instead of rallying higher, the pair reversed rapidly. Furthermore, as the downside move gained speed, prices reached a low of .7675. A trader who did not take the 12-point stop, as prescribed by the setup, would have learned a very expensive lesson, as his losses could have been magnified by a factor of three. Therefore, the key idea to remember with our "do the right thing" setup is, "I am right or I am out!"
The Bottom Line "Do the right thing" allows traders to trade breakouts confidently and successfully. CCI can put you on the right side of a trade when many others are trying to fade the price action. However, this setup only works if you apply it along with disciplined stops to protect you from major losses if the expected momentum fails to materialize.
The primary focus of CCI is to measure the deviation of the price of the currency pair from its statistical average. As such, CCI is an extremely good and sensitive measure of momentum and helps us to optimize only the highest probability entries for our setup. (For background reading, see Timing Trades With The Commodity Channel Index.)
Timing Trades With The Commodity Channel Index by Justin Kuepper
April 18 2005
The Commodity Channel Index (CCI) is an oscillator originally developed by Donald Lambert and featured in his book "Commodities Channel Index: Tools for Trading Cyclical Trends". Since its introduction, the indicator has grown in popularity and is now a very common tool for traders to identify cyclical trends not only in commodities but also equities and currencies. In this article, we'll take a look at what exactly the CCI calculates, and how you can apply it to enhance your trading.
Understanding the CCI Like most oscillators, the CCI was developed to determine overbought and oversold levels. The CCI does this by measuring the relation between price and a moving average (MA), or, more specifically, normal deviations from that average. The actual CCI calculation, shown below, illustrates how this measurement is made.
The one prerequisite to calculating the CCI is determining a time interval, which plays a key role in enhancing the accuracy of the CCI. Since it's trying to predict a cycle using moving averages, the more attuned the moving average amounts (days averaged) are to the cycle, the more accurate the average will be. This is true for most oscillators. So, although most traders use the default setting of 20 as the time interval for the CCI calculation, a more accurate time interval reduces the occurrence of false signals. Here are four simple steps to determining the optimal interval for the calculation:
Open up the stock's yearly chart.
Locate two highs or two lows on the chart.
Take note of the time interval between these two highs or lows (cycle length).
Divide that time interval by three to get the optimal time interval to use in the calculation (1/3 of the cycle).
Here's an example of this method applied to Sun Microsystems (SUNW):
Here we can see that one cycle (from low to low) starts at Oct 6 and finishes on Aug 9. This represents roughly 225 trading days, which, divided by three, gives a time interval of about 75.
Applying the CCI Since it was invented, the CCI calculation has been added as an indicator to many charting applications, eliminating the need (thankfully) to do the calculations manually. Most of these charting applications simply require you to input the time interval that you would like to use. Figure 2 shows a default CCI chart for SUNW:
Note that the CCI actually looks just like any other oscillator, and it is used in much the same way. (To learn more about oscillators, see Getting to Know Oscillators.) Here are the basic rules for interpreting the CCI: Possible sell signals:
The CCI crosses above 100 and has started to curve downwards.
There is bearishdivergence between the CCI and the actual price movement, characterized by downward movement in the CCI while the price of the asset continues to move higher or moves sideways.
Possible buy signals:
The CCI crosses below -100 and has started to curve upwards.
There is a bullish divergence between the CCI and the actual price movement, characterized by upward movement in the CCI while the price of the asset continues to move downward or sidesways.
Figure 3 shows another chart of SUNW, but for this chart, the time interval of 75 (which we calculated above) was used for the calculation:
The red arrows show turning points that emit sell signals, while the green arrow shows a turning point emitting buy signals. The short blue lines, indicating the impending trends, show the divergence between the CCI and price.
Always Get Confirmation It is extremely important - as with many trading tools - to use the CCI with other indicators. Pivot points work well with the CCI because both methods attempt to find turning points. Some traders also add moving averages into the mix. In Figure 3 above, you can see that the 60-day exponential moving average (violet horizontal line) provides a good support level; however, determining which MA level is best varies by stock (to learn more, see Introduction To Moving Averages ).
Another possible supplement to the CCI is the use of candlestick patterns, which can help confirm exact tops and bottoms throughout the CCI's "selling period" (time in which it is above 100) or "buying period" (time in which it is below -100).
Conclusion
The Commodity Channel Index is an extremely useful tool for traders to determine cyclical buying and selling points. Traders can utilize this tool most effectively by (a) calculating an exact time interval and (b) using it in conjunction with several other forms of technical.
Slow week didn't hit goal of 1.5% a day but is was a funky week and I didn't get in as much screen time as I would like 80% win stinks too was experimenting.
Account up over 300% since 01-20-2012 Can't complain too much and equity is getting back to a comfortable zone