Let's see Lufthansa....
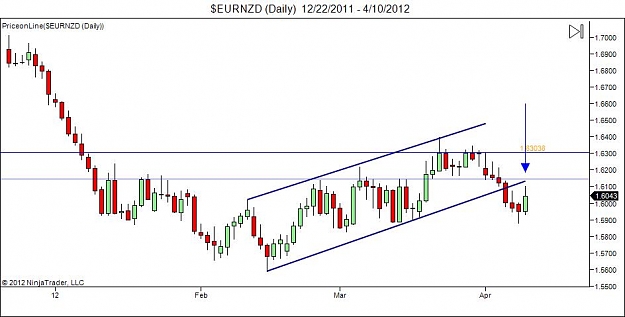
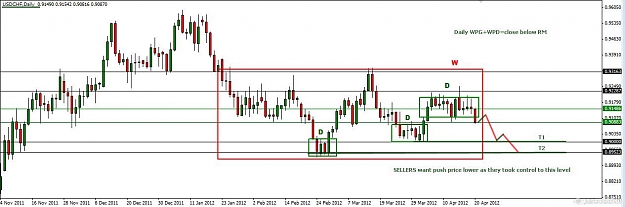
M-RM with PB at R level that nca (no close above), the SW inside the RM is the most important MM level and the TG (target) is the RM's S level.
Ignored
Outcome is not important at all, but correct technique is what only matters
Thanks Fxgroup.
Does yesterday (04/10) bar fit ur definition of PB?
Ignored
It is just the first sellers reaction @ bearish flag and the start of RET to 1.6
0.
Very often the upward tail give good information about the initial fase of the RETs.
|
Joined Aug 2010
|
Status: Roaring in a cave near you
|237 Posts
I wish to thank you for participating in this first test experiment.
As some have guessed, the test was a about a trade trap, for several reasons.
Solution #1
This is very easy to spot.
I purposedly hinted about "Also notice how dates are very important".
I visibly put a day cross hair indicator in the daily graph (look at the bottom right).
Notice how in this method the candles MUST HAVE CLOSED before you can declare that you found a pattern
Ignored
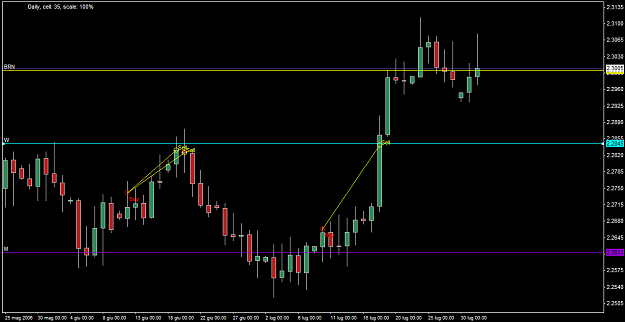
With these elements at hand, let's look at the graph. The highlighted date is July 28, 2006. That date was a Friday.
This means the weekly bar was not complete and the trade should never happened in that date.
You may still trade of course but then you will miss one of the two winner mechanics of this method: trade after candles closed and trade on confirmed retracements.
Let's look at what happened in the method suggested trade day (after week closed, that is the next day), see attachment 1.
There's a very suspicious gap with a small bullish candle. It means there's something brewing up. Only way to place a sell stop order would be to put it below it and then you get an huge stop loss => No trade.
Then the next days you see what happens: the market swings up and would have taken the stop loss (SL).
Even if you followed another SL strategy and put the SL above the swing (July 24 candle), the last candle closed above the super strong BRN 2.3, which means troubles!
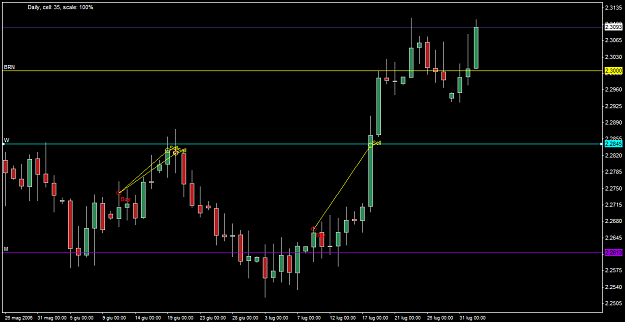
In fact if you look at the attachment 2, you see what happened next: very strong bullish rally that in the next days would have taken you out.
Above blurb in a nutshell: make sure you trade after the higher time frame bars have closed.
Solution #1Appendix #1
This is more tied to practice than this method's rules. Fridays in general and end of months are the days where very big positions are closed, market loses liquidity and is choppier. As a personal rule I rarely start a trade on Friday and never in the last 2 days of the month. This holds expecially true considering it overlaps with Appendix #2 (this made me dobious even beyond the "2 last days" advice, in fact I skipped at 3 days to end of month).
Finally, there are an handful of super-market impacting news and events (futures contracts expiration days) when trading is riskier even for a daily bars trader.
Solution #1Appendix #2
Whole second half of July and August and Christmas holidays are bad days to trade at. August is the month when liquidity is the lowest (many are in vacation) and very large funds commit their capital creating some large oscillations.
Solution #2
As FXGroup and I stated several times, you always need to consider WPD. The overall scenario hints about what the market is about to do, situation awareness is a key factor into succesful trading.
Look at the weekly chart again and figure out the RM "flavour".
The RM is not absolutely random, it shows two bullish flags.
See Attachment 3 for a modest attempt of mine to graphic art .
Once you get practiced at charts reading you'll instinctively see these things. The blue rectangles are not any kind of pattern but are what my eyes "see" as I glance at the graph.
I have drawn some trend lines too. The first bullish flag attempted to break up but it failed and formed that Feb 20 exhaustion BEOB / 2D PB. It failed because buyers started gathering liquidity from the middle.
The second time price went all the way down to the support and this gave it a bigger momentum.
daily to draw support & resistance.
n i look at 4 hours & i narrow down to 1 hour.
currently i am looking at 16th april 2012 , 8am price buy at 1.30123.
is this the right analysis?
assume it will still range..
please advise..
ty v much.
if i ask the wrong thing, please correct me too.
ty ty.
=)
Ignored
In line of principle you are more or less following part of the method, but this method is focused at trading on daily bars, not hourly.
Therefore we use monthly and weekly chart to discern the market scenario and the daily chart to find the entries. The entries will be done by using price action patterns that sit on a weekly / monthly support / resistance (and NOT anywhere else) and only if all three time frames are concordant.
"It failed because buyers started gathering liquidity from the middle."
can u explaqin this " gathering liquidity" point more? thanks for the post, BTW.
Ignored
Sure.
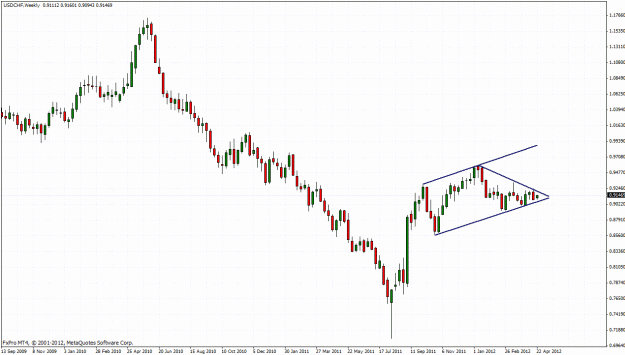
Look at the weekly chart (the one with those diagonal blue rectangles).
The Jan 30 (Gen 30) candle is an uncertainty candle hitting (and thus taking liquidity) both from sellers and buyers. It hangs in the middle, so price could not go deep down or all up to take strength.
The next week, sellers tried bringing price down to the 2.2613 M support but buyers reacted, the result is the PB. But buyers were not strong enough either. They formed another PB on Feb 13 but look, its tail won't hit the M support so it price could not "recoil" for a powerful upwards thrust. Furthermore the PB hit R W 2.2845 and failed to close above it. This is an hit at buyers being stronger than sellers but not much more so. In fact the next week the buyers managed to push through but they got stopped by the BRN 2.3.
Why did buyers manage to pass R W 2.2845 if they were so weak? Because they were weak indeed but their liquidity originated from the 2.2613 M support some weeks before. Correctly identified strong M price levels are stronger than W price levels. This is a most important information, because if you start a trade from a correctly identified strong M price level you know that you WILL see strong resistance from the W levels in the way but not strong enough to stop the price.
I underlined and bolded the "correctly identified strong" words, because if you improperly identify the M level or the M level is weak then price might be stopped by a W level indeed.
How to detect strong vs weak levels? I hope FXGroup will talk about it, it's a topic that requires some theory and practice, practice, practice and more practice.
In line of principle you are more or less following part of the method, but this method is focused at trading on daily bars, not hourly.
Therefore we use monthly and weekly chart to discern the market scenario and the daily chart to find the entries. The entries will be done by using price action patterns that sit on a weekly / monthly support / resistance (and NOT anywhere else) and only if all three time frames are concordant.
Same advice as above. We'll never see "1 hour wicks" because our minimum range is the day.
Ignored
This needs Tonnes of Patience...i will follow Monthly, Weekly & Daily as Entry.
This needs Tonnes of Patience...i will follow Monthly, Weekly & Daily as Entry.
Does it means it working on all pairs?
Thank you for the kind reply.
Ignored
Yes it works on all pairs and on all markets. It should also work on any time frame but below 1 day you are prey of stop loss hunters, bots, news, "market noise" and much more.
Actually it does not need that *much* patience because you have thousands of markets where you can apply it in the same day, you can stay sure some markets give trading opportunities each day.
How to detect strong vs weak levels? I hope FXGroup will talk about it, it's a topic that requires some theory and practice, practice, practice and more practice.
Ignored
Thanks. interesting. I would think price history will give clues. Merely counting number of touches may not be enough. A level has to demo its capable to launch strong move or stop a strong trend to be qualified as a strong level, imo.
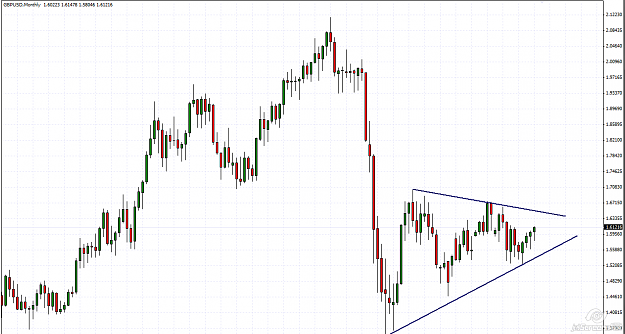
GBPUSD...nice and clear with all the TFs in the same direction.
Ignored
Hi fxgroup, great thanks for your valuable thread. I am following silently, because I am in learning and practising mode. From your GBPUSD chart, your implication are:
1- Price is going UP and approaching to the descent upper trendline. (WPD and WPG).
2- Our action: can buy in expecting profit taken near the decent upper trendline as long as R:R is allowable we take the trade. Or in this context we just wait and see WPD at the decent upper trendline before we take action.
|
Joined Jul 2008
|
Status: Member
|387 Posts|
Online Now
By the way what is image processing software you here are using to put arrow/text/shapes/... to make annotation to chart to post to the thread. Many thanks for your instruction.
Hi fxgroup, great thanks for your valuable thread. I am following silently, because I am in learning and practising mode. From your GBPUSD chart, your implication are:
1- Price is going UP and approaching to the descent upper trendline. (WPD and WPG).
2- Our action: can buy in expecting profit taken near the decent upper trendline as long as R:R is allowable we take the trade. Or in this context we just wait and see WPD at the decent upper trendline before we take action.
Great thanks for your explanation.
Regards,
Exciter135....
Ignored
Hi 135 and thanks for your partecipation.
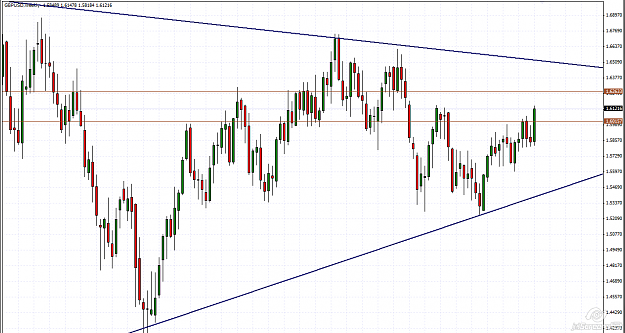
Since we identified WPD+WPG, all we have to do is to wait RET in order to get in till or MM/ targets levels....beeing carefully at important levels as 1.6170.
The software I use for capture the screenshots and work with them is JetScreenshot..is free and very easy to handle.
Since we identified WPD+WPG, all we have to do is to wait RET in order to get in till or MM/ targets levels....beeing carefully at important levels as 1.6170.
The software I use for capture the screenshots and work with them is JetScreenshot..is free and very easy to handle.
Hi fxgroup, great thanks for your reply and encouragement . I am dreaming to reach to your level in one day , then I will flood your thread with bundles of posts and pictures . Good day to you.
BRN 90 hard resistance, more buyers so more sellers welcome to cross this level.
Ignored
Let's wait for the W triangle to clear and to tell us more... !
In this kind of situation when the price is getting more close to the triangle apex, we will se more volatility and market formation with dojies as predominant candle ...where the MM becomes a really headache !
By the way what is image processing software you here are using to put arrow/text/shapes/... to make annotation to chart to post to the thread. Many thanks for your instruction.
Hi fxgroup, great thanks for your reply and encouragement . I am dreaming to reach to your level in one day , then I will flood your thread with bundles of posts and pictures . Good day to you.
Ignored
In order to reach his level you should flood the thread NOW. Only doing so, he may help you improve your abilities and give you the tips needed to improve a lot. Don't be shy.