yes we do need some indi's to get an idea of what the chart is telling us so i digged up simple but yet effective indicators that we could use as a guiding tool to go in the right direction, JUST CHOSE which ones are SIMPLE yet effective, it's better then Trading Blindly
Thanks for your support, the indicator which tracks the previous trades might be of good use. personally i want to keep the system very light with simple logic so that it can run on more number of pairs without hogging the system
From what I gathered about this system.....it keeps trading in the same direction....whether win or loss....until the price goes to the other side of the pivot?
Hi,
I am using some of the indicators. I have noticed R1 is shown twice at two different values. They are 1.31470 and 1.31541. Might have some other indicators too.
Ron
|
Commercial Member
|
Joined Jul 2009
|5,255 Posts
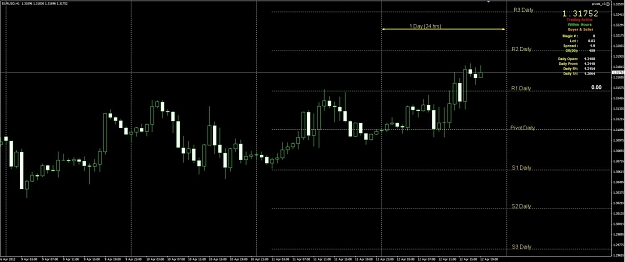
Here is a screen shot of EURUSD from last night, I am working on the rules used to enter a trade. Can you look at this and if there are any trades to be taken durring this period, can you explain how and when you would have taken them for a trade. A H1 chart is shown so you can better explain the entry points durring this almost 24 hour period.
I have seen the chart , it represents yesterday data to calc the pivot and based on that how todays trade fared .
The low of today 3105 as per my broker .
the pivot as shown in chart 3110 the day open 3108 taken from your chart so the rule is for a buy to trigger the price should cut from below .
here the price cuts 3110 from below to trigger the buy .
type of market is determined a pivot and of type normal as the open is near the pivot.
so the first trade kicks at break of 3110 for 30 pips so we hit 3140 .
alongwith chart if you can give me raw broker data of yesterday it helps ( ohlc ) pivot r1 and s1 and today open , if you give me these data then it helps
for now we will take this trade only . there is point where madness kicks in but that will be implemented later on.
another strong buy trade fires on brk of R1 , but this will not be taken in this case as the market type is normal . so whole day it will be normal type market.
in a day we will determine the type of market only once , not confuse ourselves with break of r1 etc.
seller9 I also need your inputs as to how you will react or use this information to trade if you are 100 % sure of a tgt which is going to be hit.
I mean if you pre know that EU will hit 3300 when it is at 3050 how will this information be used in trading .
This is not connected to the EA implementation , just asking your opinion . Can the EA help us in any way if we know this information before hand.
Ignored
we cannot know beforehand what the market will tell us with or without any indi's but we can speculate with the help of some simple indi's like the Pivots - S/R - ATR or ADR's - Fractals or Sup/Dem zones and obviously not forgetting PA which is the most important of them all especially when the price breaks either High/Low/Open/Close of previous Candles or simply a break of a PRICE RANGE CHANNEL based with HOUR criterias
i will post something later on based on seller9's chart that he posted and give my POV.
The most important part of this is the overall GAIN in PIPS
Don't forget Practice + Patience + Persistence = Profits
If the price cuts the pivot from below multiple times a day, then we trade only the first cross, or trade the later ones too?
In the picture I made:
The first yellow marked candle cuts through the pőivot from below, so we open 3 long positions. All of these are reached their take profit levels in the next couple of candles. After that there is another cross from the bottom on the second yellow marked candle (on 1 min timeframe you can see that the price moved under the pivot and then came back up, and down again).
There are no open positions currently, so we open another 3 long? The first 2 with 10 and 20 pip tp are reached their targets in the next 2 candles, so on the 3rd yellow marked candle we can open these 2 positions again (the third position with tp 30 are still opened)? And if so, then the 10 pip target reached again before the 4th marked candle, so there we could open that again, and this time all 3 tp levels reached, and the price didn't fall below the pivot for the remainder of the day.
So if this is the right method, then there would be 4 trades with tp 10, 3 trades with tp 20, and 2 trades with tp 30. 160 pips total. Is it right, or we only trade the first pivot breakthrough?
I have seen the chart , it represents yesterday data to calc the pivot and based on that how todays trade fared .
The low of today 3105 as per my broker .
the pivot as shown in chart 3110 the day open 3108 taken from your chart so the rule is for a buy to trigger the price should cut from below .
here the price cuts 3110 from below to trigger the buy .
type of market is determined a pivot and of type normal as the open is near the pivot.
so the first trade kicks at break of 3110 for 30 pips so we hit 3140 .
alongwith chart if you...
Ignored
OK, I agree with what you are saying, thats the way I see it and this is one of the rules I have coded in so far.
To this we may also want to add Normal Market = true so we only use this rule if its a Normal Market once we determine the rules for a Normal market.
if(YesterdayClose<PivotD && TodaysOpen<PivotD && Price Breaks up through Daily Pivot) = Buy Signal
Questions:
1) Should I leave the YesterdayClose in the rule or remove it and just use TodaysOpen above or below Pivot? I would think that they should be the same most of the time but I thought I saw someplace where you looked at Yesterdays Close in reference to the Daily Pivot.
2) When the PA breaks the Pivot do you want it to place a trade right away or do you want a user settable number of pips above or below the pivot before the trade is placed? Kind of a buffer that keeps you out of whip lash back and forth across the pivot.
3) When you say the open is close to the pivot so it is a Normal Market, how close to the Pivot is considered a Normal Market? We need to put some sort of number or percent on this closeness with reference to pips or R1 or S1 so the EA can determine this. In a Buy case is Normal all the way from Pivot to R1?
4) One last question, do you think we should build in a short delay so no trades are placed at the exact moment the market switches between days as at that time everything is being recalculated and the EA could get confused as we switch between today and yesterday?
5) Missed one: In this case stop loss goes 30 pips below pivot or entry price? Does it move as trade hits T1, T2, and T3?
This is probably a redundant question that you answered before but just want to get everything nailed down the right way.
we cannot know beforehand what the market will tell us with or without any indi's but we can speculate with the help of some simple indi's like the Pivots - S/R - ATR or ADR's - Fractals or Sup/Dem zones and obviously not forgetting PA which is the most important of them all especially when the price breaks either High/Low/Open/Close of previous Candles or simply a break of a PRICE RANGE CHANNEL based with HOUR criterias
i will post something later on based on seller9's chart that he posted and give my POV.
The most important...
Ignored
we cannot know beforehand what the market will tell us with or without any indi's >>>> appreciate your inputs but my question was a little different i asked suppose you know the figure very early then how u will use the information .
Think only about this information and how to get the maximum out of it . when you think about my question dont bring the current trading logic into your mind. indicator etc .
The most important part of this is the overall GAIN in PIPS :money >>> yes u got it 100 %
OK, I agree with what you are saying, thats the way I see it and this is one of the rules I have coded in so far.
To this we may also want to add Normal Market = true so we only use this rule if its a Normal Market once we determine the rules for a Normal market.
if(YesterdayClose<PivotD && TodaysOpen<PivotD && Price Breaks up through Daily Pivot) = Buy Signal
Questions:
1) Should I leave the YesterdayClose in the rule or remove it and just use TodaysOpen above or below Pivot? I would think that they should be the same most of the time...
Ignored
At last we seems to be moving ahead and nice to see some beautiful questions..
OK, I agree with what you are saying, thats the way I see it and this is one of the rules I have coded in so far.
To this we may also want to add Normal Market = true so we only use this rule if its a Normal Market once we determine the rules for a Normal market.
if(YesterdayClose<PivotD && TodaysOpen<PivotD && Price Breaks up through Daily Pivot) = Buy Signal
Questions:
1) Should I leave the YesterdayClose in the rule or remove it and just use TodaysOpen above or below Pivot? I would think that they should be the same most of the time but I thought I saw someplace where you looked at Yesterdays Close in reference to the Daily Pivot.
2) When the PA breaks the Pivot do you want it to place a trade right away or do you want a user settable number of pips above or below the pivot before the trade is placed? Kind of a buffer that keeps you out of whip lash back and forth across the pivot.
3) When you say the open is close to the pivot so it is a Normal Market, how close to the Pivot is considered a Normal Market? We need to put some sort of number or percent on this closeness with reference to pips or R1 or S1 so the EA can determine this. In a Buy case is Normal all the way from Pivot to R1?
4) One last question, do you think we should build in a short delay so no trades are placed at the exact moment the market switches between days as at that time everything is being recalculated and the EA could get confused as we switch between today and yesterday?
5) Missed one: In this case stop loss goes 30 pips below pivot or entry price? Does it move as trade hits T1, T2, and T3?
This is probably a redundant question that you answered before but just want to get everything nailed down the right way.
Should I leave the YesterdayClose in the rule or remove it and just use TodaysOpen above or below Pivot? I would think that they should be the same most of the time but I thought I saw someplace where you looked at Yesterdays Close in reference to the Daily Pivot.
NO Yesterday Close is not needed . The sequence is like this , at open of the new day we find out what type of the market it is by finding the open value and matching it with pivot or s1 or r1 which ever is close by , the market is of that type.
Next comes the buy or sell rule . a buy is triggered whn the price cuts the ( pivot , r1 or s1 whichever type we select) from below and a sell is trigged when the sell value which at present is kept at ( pivot , r1 or s1 whichever type we select) minus 30 pips is cut by the price from above.
2) When the PA breaks the Pivot( selected pivot) ( pivot , r1 or s1 whichever type we select) do you want it to place a trade right away or do you want a user settable number of pips above or below the pivot before the trade is placed? Kind of a buffer that keeps you out of whip lash back and forth across the pivot.
suppose we select today market pivot is 1.3120 and the price is coming from say 3125 then we shall wait for it to brk 3120 and go dn , the price hits 3115 and then comes up to cut 3120 then at 3121 our buy will fire , you can keep a pending order to fire as the entry is pre known ( prefered ) so for now we keep 5 pips as buffer , price dips below by 5 pips and then cuts above we fire the trade .
3) When you say the open is close to the pivot so it is a Normal Market, how close to the Pivot is considered a Normal Market? We need to put some sort of number or percent on this closeness with reference to pips or R1 or S1 so the EA can determine this. In a Buy case is Normal all the way from Pivot to R1?
suppose in the morning of the new day when your broker give you a new day , within 5 minutes the type is determined normally, then once this is determined then the market remains the same for the entire day . so when we get a pivot market then as it progresses t3 might cut R1 but that wont makes us change the character of the market to strong etc for the day , it will continue to remain a normal market even when it cuts R1 later on.
The EA should match each of the R1 S1 and PV from the open to find the close one to it which ever is close it will be taken, the pivot or r1 or s1 figure will be within the high and low of the morning.
4) One last question, do you think we should build in a short delay so no trades are placed at the exact moment the market switches between days as at that time everything is being recalculated and the EA could get confused as we switch between today and yesterday?
EA should start its calculation say 10 minutes after a new day begins . EA should stop taking trades 6 hours before the new day begins . so ea gets 17.50 hrs of trading time .
5) Missed one: In this case stop loss goes 30 pips below pivot or entry price? Does it move as trade hits T1, T2, and T3?
This is probably a redundant question that you answered before but just want to get everything nailed down the right way.
see it is very simple suppose we have a selected pivot at 3120 now minus 30 pips( user selectable) the sl should be placed so that is 3120 - 30 = 3090 . our buy fires at 3121 for tp1 which is 10 pips so 3120 + 10 =3130 = tp 1 tp2 is 3140 and tp3 is 3150 .
so this a trade , to be booked at tp3 , tp3 is point of reversal . now whn the price is at 3120 sl is 3090 whn the price is at tp1 sl is 3120 - 1 minus the spread. ( user selectable ) when the price is at tp2 then our sl is tp1 minus - 1 minus the spread ( spread is avg spread say for eu if broker is giving 1.6 we make it 2 ) . and when price is at tp3 our sl is at tp2 minus - 1 minus the spread . as we hit tp3 the trade closes.
If the price cuts the pivot from below multiple times a day, then we trade only the first cross, or trade the later ones too?
In the picture I made:
The first yellow marked candle cuts through the pőivot from below, so we open 3 long positions. All of these are reached their take profit levels in the next couple of candles. After that there is another cross from the bottom on the second yellow marked candle (on 1 min timeframe you can see that the price moved under the pivot and then came back up, and down again).
There are no open positions...
Ignored
zool here we are not concerned with time frame, only time frame is all should happen within the day . 1m 5m 15 m has no meaning here .
yes every time a price cuts from below a trade fires, you are correct if what you have stated happened within the time period of one day then it is correct .
At last we seems to be moving ahead and nice to see some beautiful questions..
OK, I agree with what you are saying, thats the way I see it and this is one of the rules I have coded in so far.
To this we may also want to add Normal Market = true so we only use this rule if its a Normal Market once we determine the rules for a Normal market.
if(YesterdayClose<PivotD && TodaysOpen<PivotD && Price Breaks up through Daily Pivot) = Buy Signal
Questions:
1) Should I leave the YesterdayClose in the rule or remove it and just use TodaysOpen above...
Ignored
Question #3: So you are saying what ever the open is closest to (Pivot, R1, S1) will determine the type of market? So if the market opens above the pivot but below R1 but closer to R1 the market will be Strong Buy? Or does it have to open at or above R1 to be a strong buy market?
Question #3: So you are saying what ever the open is closest to (Pivot, R1, S1) will determine the type of market? So if the market opens above the pivot but below R1 but closer to R1 the market will be Strong Buy? Or does it have to open at or above R1 to be a strong buy market?
Ignored
So you are saying what ever the open is closest to (Pivot, R1, S1) will determine the type of market? >>>>> yes
So if the market opens above the pivot but below R1 but closer to R1 the market will be Strong Buy? >>> NO the high and low will fit inside the PV or R1 then only it is taken , in this case we can say it will be a strong market but then it has to confirm by the high hitting R1 then only .
for if the price moves abv r1 then only it is a strong buy suppose the high in the initial time hits abv r1 then it is a strong market.
i think for now we do it as we go along and our mind meets this will get sorted out.
zool here we are not concerned with time frame, only time frame is all should happen within the day . 1m 5m 15 m has no meaning here .
yes every time a price cuts from below a trade fires, you are correct if what you have stated happened within the time period of one day then it is correct .
Ignored
I know that this method is independent from time frames, but on a daily candle you can only see if the pivot is crossed, and the tp1 or sl is reached.
When, how, and how many times the pivot cross happened only can be seen on lower timeframes (1 min or 5 min to be precise). That's why I mentioned the time frames I used to analyze yesterday's movements.
Sorry to interject here. A little off topic but while Ultimate EA is being developed I thought of seeking some expert help here.
I am experiencing an excellent system with potential to give lots of pips but do not know how it would test over period of time. So need help develop an EA using better volume indi.
Here is my system for EA:
1) throw better volume chart bars v1.4 indi on H1 chart (shows all blue professional bars)
2) 1 or 2 bars after the blue professional bar close above or below it then EA gets ready to trigger trade. so if close is above blue bar then buy ready and below close sell ready.
3) Now when 2 happens the limit orders are set i.e. if sell trade ready then limit sell at high of the blue professional bar and if buy ready then limit buy at low of blue bar.
4) Stop loss to be 10-20 pips above or below the blue trigger bar (user defined)
5) TP is 30-100 pips depending on how good the trend appears (user defined)
6) If SL hit then trade in opposite direction with same SL and TP
Can any expert develop this EA so we can test it and implement based on results. Thanks
Sorry to interject here. A little off topic but while Ultimate EA is being developed I thought of seeking some expert help here.
I am experiencing an excellent system with potential to give lots of pips but do not know how it would test over period of time. So need help develop an EA using better volume indi.
Here is my system for EA:
1) throw better volume chart bars v1.4 indi on H1 chart (shows all blue professional bars)
2) 1 or 2 bars after the blue professional bar close above or below it then EA gets ready to trigger trade. so...
Ignored
Contact Steve Hopwood on his forum and he may help you out.