No need to mix all these pivot up, see a yearly pivot might be flat , but a monthly can be strong, and at the same time a week pivot might be weak and the day might be flat .
so we should not mix all of these and confuse ourselves, each is different and ultimately we are going to trade using the daily pivot and not weekly or monthly or yearly , they are meant for guidance purpose . but they are very powerful and has a solid use.
suppose the yearly says we are going to crash down to 500 pips then you can be rest assured that the other pivot...
What do you want the EA to do next now that we have the pivots and R1 and S1??
Ignored
simple based on the open it should identify the type of market . I am going slow as if i go fast then may be we will have to revisit back to explain things .
simple based on the open it should identify the type of market . I am going slow as if i go fast then may be we will have to revisit back to explain things .
if you are comfortable then we can move fast.
Ignored
>>>>>>>>>>>>>>>>
Expecting EA to show these answers ,
>>>>>>>>>>>>>>>>>>>>>>>>>>>>>>>
now the ea should catch the type of market based on the opening , so here are the manual catch based on the opening , ea should emulate it
>>>>>>>>>>>>>>>>>>>>>>>>>>>>>>>
day pivot 1.33421 ea should go for r1 and tell that the market is a strong one
week pivot 3310 ea should go for r1 and tell that the market is a strong one
Monthly pivot 3243 ea should go for r1 and tell that the market is a strong one
Yearly 3584 ea should take it & tell this is a normal year and the current trend is flat ( or no trend )
|
Commercial Member
|
Joined Jul 2009
|5,255 Posts
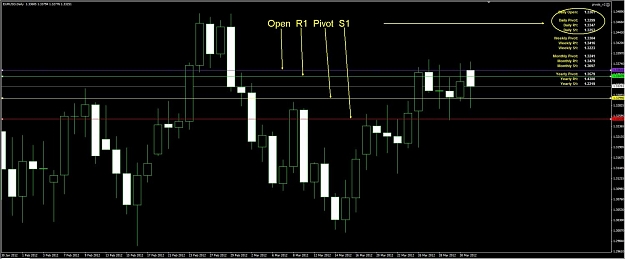
Just for reference can we use the same numbers the EA is getting from my demo account shown below on the chart. I have drawn them in and markered the Daily Pivot, R1 and S1 and also todays Open. What do you want the EA to do next?
What would you have done at the open with these numbers or what would you have waited for to happen before going any further?
Your above R1 and also above the Pivot.
What would have the EA triggered on to make a purchase?
ok now i understand your problem , as each broker is different we will have a different pivot for each broker, so if you are using the this particular broker for demo purpose then we use only this broker in future .
ok so i have see you have clearly marked the open r1 s1 and pv as straight line in chart .
so at the open that figure we need to compare with the figure of s1 pv and r1 . so in this case the open is high than the r1 , under no circumstances the EA will move out of this band of R1 S1 and PV adjustment, even when the open is way up than these figures .
so based on the opening of yesterday this is the inference , we will have to adjust to R1 as told by me manually . and then the trading logic will be decline to R1 on cards.
A buy is triggered when then price cuts the R1 from below and a sell is triggered when the price cuts the sell figure ( to be worked ) from above .
I dont want the EA to do any trading as of now . I want the logic to working properly so we try to achieve that.
I am giving you todays inference ,
EU DAILY :-
2012.04.0200:001.335271.338011.327771.33286
The above quote has been received from my broker representing yesterday action in EU
I have made it into 4 digit from 5 digit . ( this the ea should do )
so the pivot i am getting is 1.33288 since the open is above this figure we will have to adjust ourselves and the EA should say it is using R1 for today's market and market is strong above the R1.
Since we might need lot of information to be displayed on the screen for the benefit of the user , it might be a good idea to blank out the screen of all the price lines in future.
Let me know if you have any questions
The EA should have 5 Tgt on the sell side and 5 target on the buy side and 2 SL one for buy and one for sell and one sell value and one buy value .
These things need to be built in the EA before we let it trade . The 5 targets should be user fed . I mean the user will feed is say 10 pips then automatically at each 10 pip interval the 5 target will be displayed. similarly for SL .
As regards the week and month we might have to display may be arrows of up and down and type of market and what the price is doing like upward move or retrace like that. once the EA is done then we can simply switch all these display if the user does not want it to be displayed. Since this system is not a indicator or a visual treat , it is very different from all the other systems as it is purely on the figures.
once we catch the open correctly for all the time zones then we will move to trading logic portion and then post this we will let the EA do some test trade .
ok now i understand your problem , as each broker is different we will have a different pivot for each broker, so if you are using the this particular broker for demo purpose then we use only this broker in future .
ok so i have see you have clearly marked the open r1 s1 and pv as straight line in chart .
so at the open that figure we need to compare with the figure of s1 pv and r1 . so in this case the open is high than the r1 , under no circumstances the EA will move out of this band of R1 S1 and PV adjustment, even when the open is way...
Ignored
Can you put together a list of the logical steps you want the EA to perform, so far we have the firt step. Also if there are any paces where the user must intervene in this sequence list those also.
1) Calculate Daily, Weekly, Monthly, Yearly Pivots, R1, and S1.
Can you put together a list of the logical steps you want the EA to perform, so far we have the firt step. Also if there are any paces where the user must intervene in this sequence list those also.
1) Calculate Daily, Weekly, Monthly, Yearly Pivots, R1, and S1.
2)
3)
4)
5)
6)
etc.
Ignored
[quote=seller9;5536082]Can you put together a list of the logical steps you want the EA to perform, so far we have the firt step. Also if there are any paces where the user must intervene in this sequence list those also.
1) Calculate Daily, Weekly, Monthly, Yearly Pivots, R1, and S1.
2) First day of the month week or year is the time when one sets the pivot, once it is set it remains valid for the time period set , and daily is set daily . now the next step is at the open as the case may be we calculate the pivot and also catch the type of market ( R1 or S1 or Pivot ) if R1 then market is a strong BUY if pivot then market is normal and above pivot is in buy mode and if S1 market is weak below pivot can crash . but above this pivot it is a cheap buy althoug weak .
3) Now we have the piovt and the setting adjusted as per open , now we will proceed to trading , for trading we will need 5 tgt buy side 5 target sell side and 1 sl each for buy and sell , so we will allow the user to input the figure , so if he says 10 pips then all the 5 target will be calculated in the buy side we just add 10 pips to arrive at each tgt and opposite in case of sell side.
4) our trade fires based on daily values , ( however as potential big trade will be checked by the EA on the Weekly and Monthly and yearly , so we will take from the user the weekly value for the 5 target , same applies for monthly and yearly . when such a trade is identified on a bigger time frame and it matches with the daily we allow the trade to run .
5) Entry rules as sell is triggered when the price cuts from above and a buy is triggered when the price cuts from below
6) TP rule , booking is at t3 value or the 3rd value always and the initial sl is moved to cover the buy price when it t1 in the case of daily , in the case of weekly or yearly or monthly the booking is done on achieving the targets , all exit via trigger sl .
you are going in the wrong track , there is no need to compare my pivot with your pivot , you can only compare similar with similar , if i am trading with fxdd broker and you are also with fxdd broker then our pivot must be same and it makes sense, but in forex each broker gives his own feed and you have take it and use it to play as you are going to execute the orders with your broker and not with any other broker.
so it is fine . when you use the fxdd generated pivot with your brokers that is when your trouble begins.
Can you put together a list of the logical steps you want the EA to perform, so far we have the firt step. Also if there are any paces where the user must intervene in this sequence list those also.
1) Calculate Daily, Weekly, Monthly, Yearly Pivots, R1, and S1.
2) First day of the month week or year is the time when one sets the pivot, once it is set it remains valid for the time period set , and daily is set daily . now the next step is at the open as the case may be we calculate the pivot and also catch the type of...
Ignored
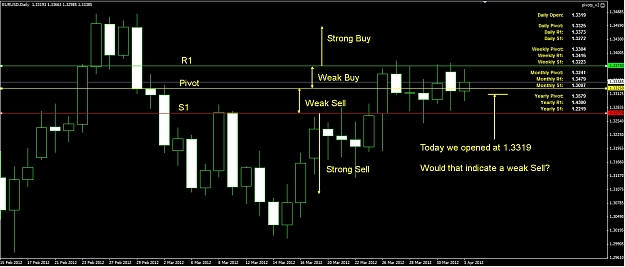
Take a look at the chart below, is this correct or what should be the area for the Normal, weak buy, strong buy, weak sell, strong sell.
Point one since we missed to catch the open on the first of the week and month , let us concentrate on day for now. we will come to month week and year later on .
Please post your broker data of yesterday and today daily so that i can verify them manually .
Yesterday Data
2012.04.0300:001.332991.33671.321281.32217
2012.04.0400:001.32221.323251.318221.31987
so today open is 1.3222 ( in your case it is 1.3219 ( that is fine as broker to broker it will vary 2-3 pips as this is not a exchange controlled market like stocks )
we will catch the pivot today and say that the market is of a normal nature and only above we have a normal buy and below it we have a normal sell .
point to note had we caught the weekly and monthly then they will be saying that the market is in sell mode on month basis to hit 3243 and 3101 ( pv and s1 ) so month trend is sell for eu
week will be saying since R1 hit has failed it is heading for week pv of 1.3101 since both the week and month match there is a high probablity of hitting 1.3101 for EU
with reference to your chart seller9 the open 3319 and pivot 3325 which means since they both are close by we take it as a pivot market ( or normal market ) favor the buyers and sellers equally , if it trades abv the pivot it is targeting r1 and if it trading below it is targeting s1 .
if your ea can catch and tell us what type of market for week month and day , i think we should move ahead to setting up a trade .
for that we need 5 tgt on the buy side and 5 tgt on sell side and we need to arrive at a sell value so we need the 2 sl one for buy and one for sell .
we will first do the buy side 5 tgt and then we will do the sell side .
so if you can code these in ea 2 morrow when the ea is loaded , it should display these things
1. based on open it tell me what type of market for day , month and week ( for week, week open and for month it is month open )
2. It should have a user defined tgt ( pips to be inputed for now we put 10 pips ) so it plots me 5 tgt each with a gap of 10 pips on thebuy side and displays
if we do this portion , we will take up the sell side next .
once we have both sides ready and sl also ready we can allow the ea to do its first trade.
This is the result :- 2012.04.0300:001.332991.33671.321281.32217
so if the EA was made to take the trade at buy abv 3329 then it would have hit tgt 3 at 3359 ( thus getting 30 pips ) and if we have fired a sell at say 30 pips below the pivot then it would have hit 3298 >> 3213 so around 80 pips
so all total we would have netted 30 plus 80 = 110 pips on EU yesterday .