Dislikedyes this is an easy way to view moving averages in an effective way too. I don't use them anymore because you can often see this without them. BUT they are a great tool to help guide and notice instances like this. They should be used like any other tool. Thats what James says.
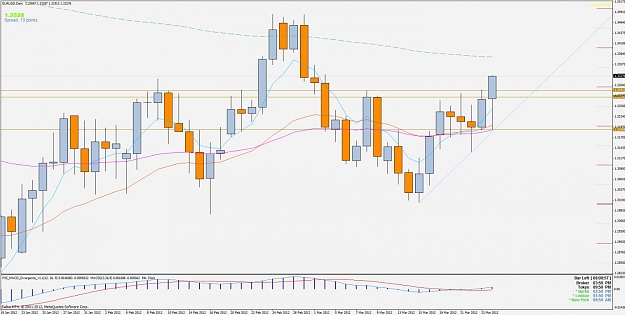
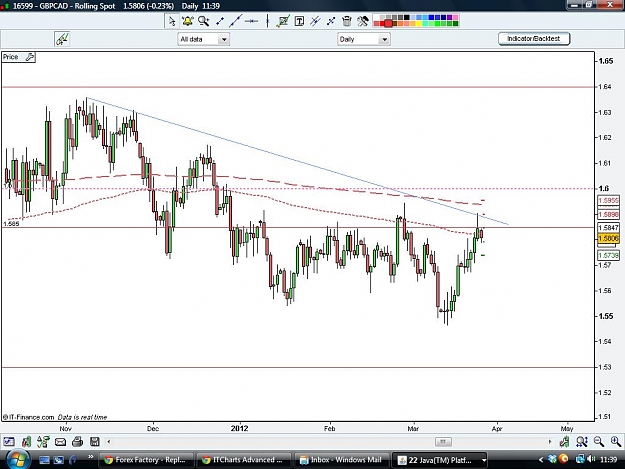
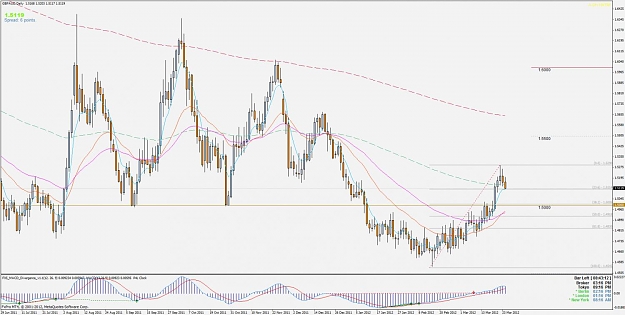
Notice how they are all flattening out and laying on top of each other. This is telling us price is flat(sideways) and we can then validate that by seeing the box and utilizing the other information here(BRN, PPZ, etc). Another heads up if you use MAs (multiple...Ignored
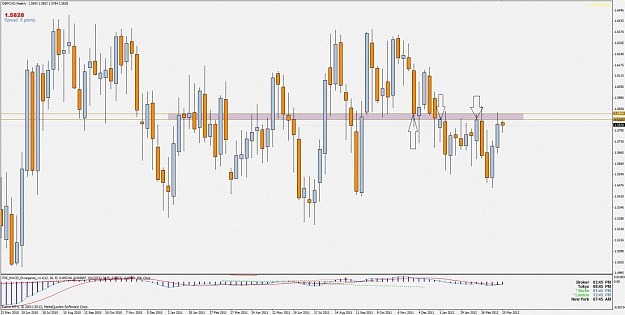
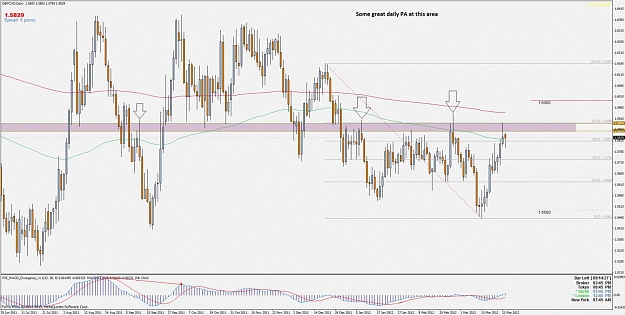
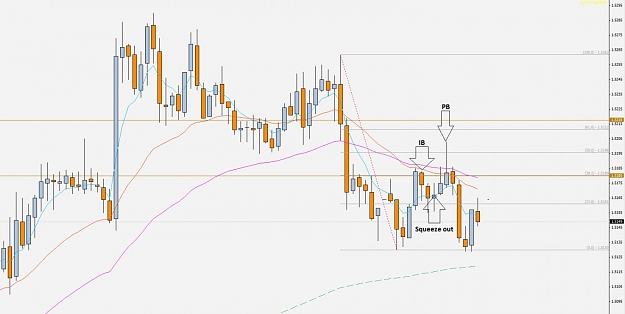
Stuck between two EMAs, then we get an IB and a touch.
I have been studying Patrick's entries very closely.
Yes, as a confluence tool, seems very exciting.
Funny, but when I first studied the base on the PF, it looked totally random.
Now, I know we need to use it as a confluence tool as you say and not the magic bullet.
Another part of the puzzle clicks into place.
Thanks Mike.
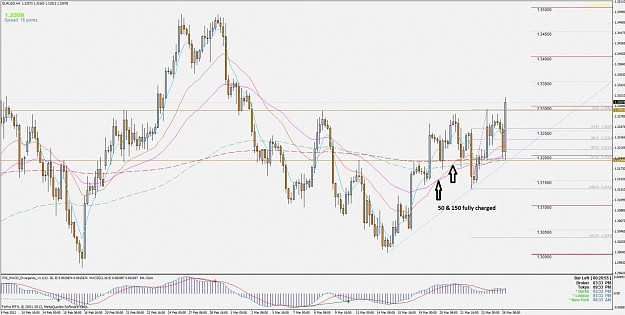
![Click to Enlarge
Name: 2012-03-26- [EURUSD,H1].jpg
Size: 98 KB](/attachment/image/928394/thumbnail?d=1365754266)