I spent the last month of 2011 and the first month of 2012 getting chopped to pieces. In Feb. I started to find my groove again trading 5 bar range charts, when I had a chance conversation with an old trader friend who tried his best to convince me that as you get older the smaller timeframes are too stressful. I didn't want to listen, partly because I felt it was true, but I did politely listen to his presentation. Me being me, I took what he said and started trying to make it my own, not by coming up with anything original per say, but by adding recycled filters readily available and discussed on forums like this one.
What I came up with is a super easy - less stressful way to trade just about any market. I have not tried every market, just GBPUSD, EURJPY and Oil. But if it works on those three, it should work on anything.
The principle of the system can be sumized by the following Jessie Livermore quote:
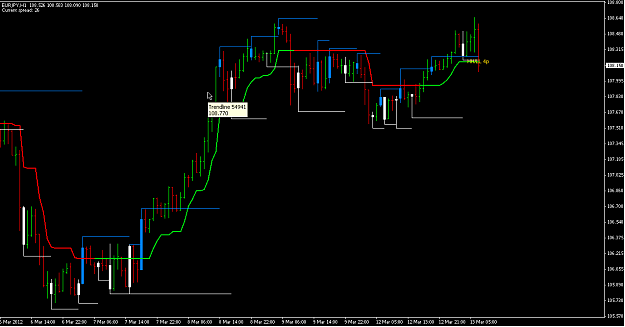
So to determine those lower/higher levels I added an indicator to visually point out the higher highs/lower lows.
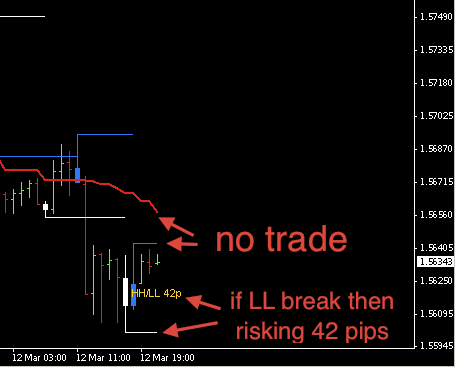
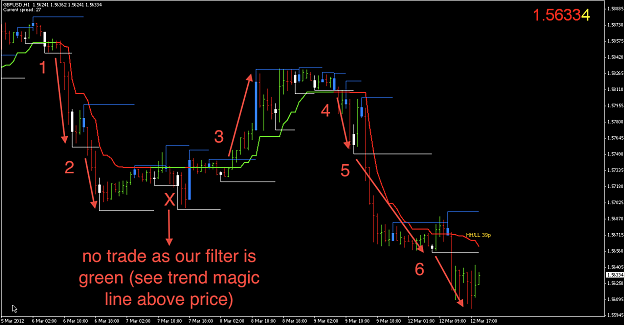
When price breaks through one of the levels I am them using T3 Trend Magic indicator to filter trades. If the color is bearish and a lower low is broken - its a good trade. If the filter is green and a lower low is breached - pass. The opposite is true for longs, we need an existing high to be broken with a green line in order to go long.
That's it. I know it seems a bit too simplistic, but, thats it. If you want to slightly complicate it (not by much) look for inside bars before the breaks. Search this forum for DIBBS or PETER CROWNS for more on inside bars.
What I came up with is a super easy - less stressful way to trade just about any market. I have not tried every market, just GBPUSD, EURJPY and Oil. But if it works on those three, it should work on anything.
The principle of the system can be sumized by the following Jessie Livermore quote:
When I’m bearish and I sell a stock, each sale must be at a lower level than the previous sale. When I am buying, the reverse is true. I must buy on a rising scale. I don’t buy long stocks on a scale down, I buy on a scale up.
So to determine those lower/higher levels I added an indicator to visually point out the higher highs/lower lows.
When price breaks through one of the levels I am them using T3 Trend Magic indicator to filter trades. If the color is bearish and a lower low is broken - its a good trade. If the filter is green and a lower low is breached - pass. The opposite is true for longs, we need an existing high to be broken with a green line in order to go long.
That's it. I know it seems a bit too simplistic, but, thats it. If you want to slightly complicate it (not by much) look for inside bars before the breaks. Search this forum for DIBBS or PETER CROWNS for more on inside bars.
Attached Image (click to enlarge)