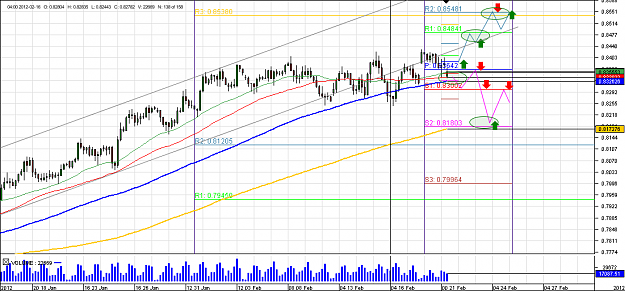
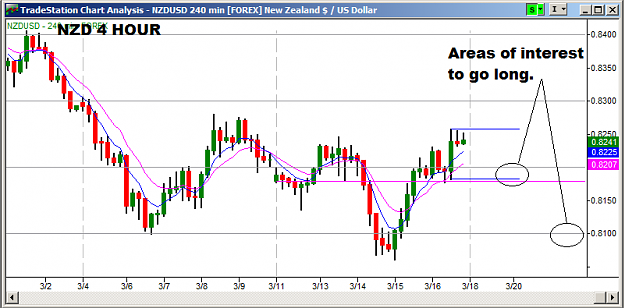
4) >>> Nzd/Usd <<< Weekly view - 4 Hours Chart (21-25th of February):
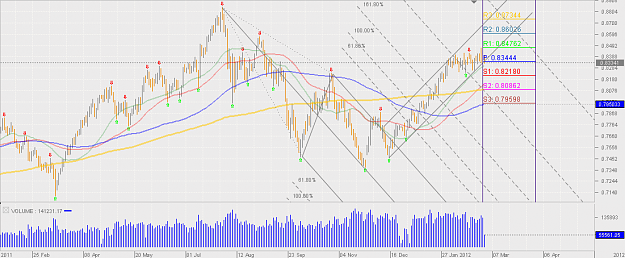
Bearish Probability: - Kiwi has been trending inside an Uptrend Channel on the 4Hours Chart. The main uptrend Line has been broken downside. If the 0.836-0.830 area(key area confluence between 100SMA, Weekly Main Pivot, weekly S1 Pivot, 30 and 500SMA cross) will be broken downside, price could reach 0.818(Key-Level confluence between 200SMa and Weekly S2 Pivot, the level that holds the uptrend on the 4Hours chart).This is a strong support area for a bullish retracement back to Weekly s2 Pivot.
Bullish Probability - above the 0.836-0.830 Area will rise back above the Main Uptrend Line and reach first 0.848(Weekly R1 Pivot) and then 0.854 Area (Strong Key-Level, confluence between Weekly R2 Pivot and Monthly R3 Pivot).
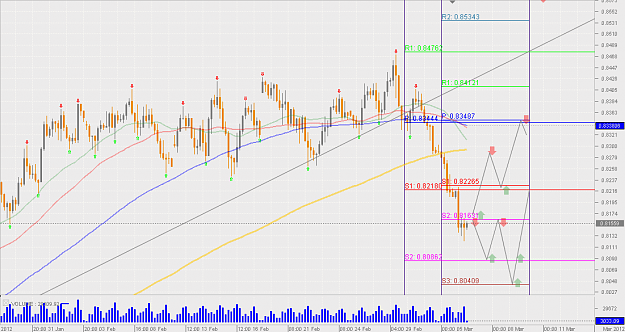
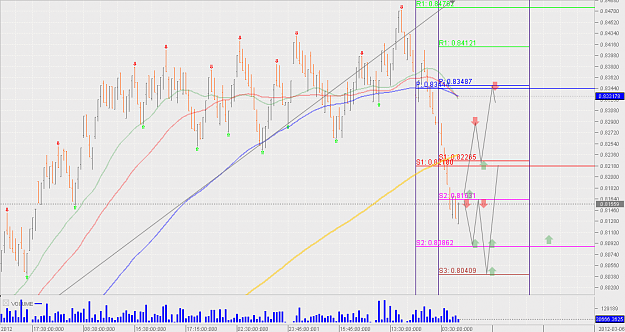
Attached Image (click to enlarge)