http://img.ehowcdn.com/article-page-...ts-800x800.jpg
Reading forex price action is as much an art as it is a science. Chart-reading in the foreign exchange market, otherwise known as forex, can be particularly challenging for chart analysts. Chart readers typically analyze the relationship between price and volume. Forex trading is decentralized with trade transactions taking place at various centers around the world. As a result, volume data is unreliable and forex analysts are forced to focus entirely on price action.
Instructions
Things You'll Need
- Forex chart software
- Forex data feed
1 - Set the chart time frame. Day traders typically use intraday price charts with trade intervals set anywhere from one to 30 minutes.
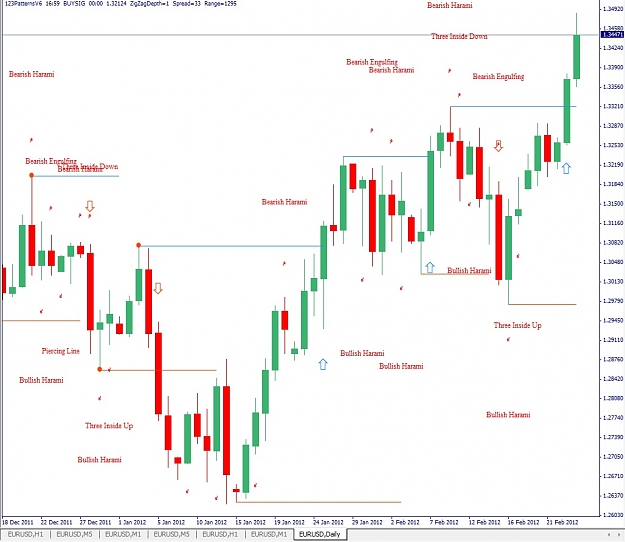
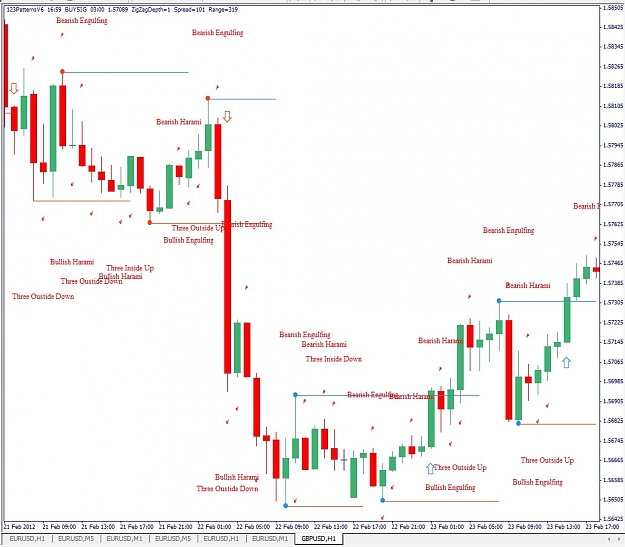
2 - Choose price measurement type. Japanese candlestick charts generally work better for forex traders, as they allow analysts to see the open, close, high and low information for each price interval.
3 Measure price support. Use your chart-drawing tools and draw a line connecting price lows on the chart. This will give you an idea where buyers have recently supported the price.
4 - Measure price resistance. Draw a line on your chart connecting price tops. This will help you determine the price area where a supply of sellers resides.
5 - Determine whether there is a price trend or a trading range. If the price support line you drew is generally angled higher from left to right, it is safe to assume that the price is in an uptrend. If the support line is flat, the currency pair is likely randomly trading in a range.
Read more: How to Read Price Action in FOREX Charts | eHow.com http://www.ehow.com/how_7566289_read...#ixzz1nQkyRcQi