Hello,
Interesting yet in response the view I have is as such.
1500 has not been so much as tested in the spot market for over 7 months. This vastly increases demand at said level, not only by spot traders, the the gold options market, futures, dealers, etc.
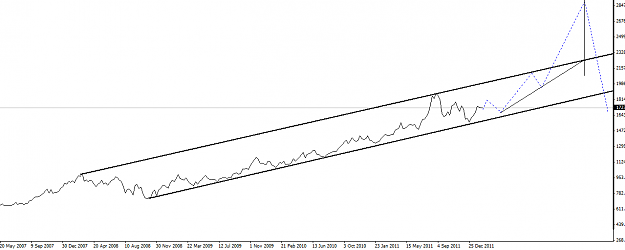
Secondly, you would have to violate and sustain a weekly channel that has been in tact tightly for the past Four years, (starting in 2008) Bullish channel was triggered after first attempts at 1000 then correction into the 700s next a breach and the level 1050 sustained sealed support...
Ignored
Thank you for your insight!
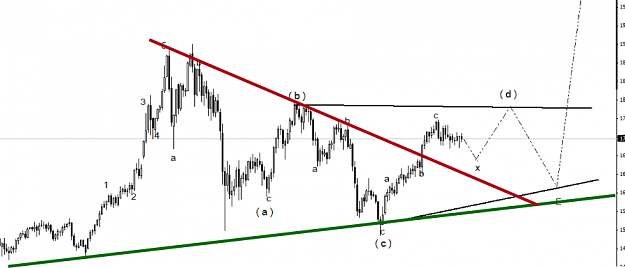
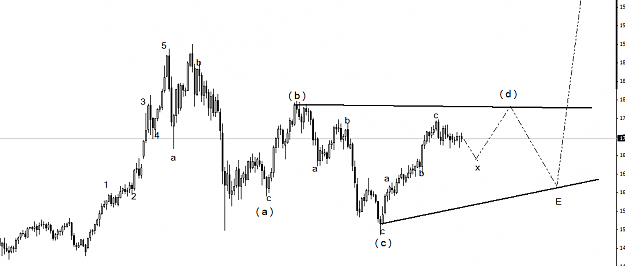
I don't think gold will come in near future closer than $50 to 1500 level. Regarding the longterm channel. I expect first the price to touch the upper trendline then, after the minor retracement, the major breakout to the upside at least $300+. imho only then the lower trendline will be violated. On daily chart I have a neat neowave contracting triangle with reverse alternation (b<d) which is ending soon. Take a look at bloomberg' fresh article about gold http://www.bloomberg.com/news/2012-0...mmodities.html
You know what happens when everyone (and their cats) jump in the same wagon . me thinks $100-150 correction is coming soon all the way down to 1610
Anyway, PBOC cut RRR, it's gonna be quite bullish for copper near term
Joined Aug 2009
|
Status: Patience = Simplest of all skills
|7,152 Posts
NP
I am not sure of what you are saying in the below bolded line.
There are longer term bullish Trend lines as well that come in at different ranges depending on how they are drawn and what the origin is.
I am only using the past 4 years and trading on a weekly for simple analysis.
The trend is far longer as you know.
In actuality I don't like to see the price Blow Itself out of the channel too far,
because then we usually have a semi dull corrective period back to a support.
Then buying resumes.
By your chart it seems you are more bullish gold the long term.
Thank you for your insight! I don't think gold will come in near future closer than $50 to 1500 level. Regarding the longterm channel. I expect first the price to touch the upper trendline then, after the minor retracement, the major breakout to the upside at least $300+. imho only then the lower trendline will be violated. On daily chart I have a neat neowave contracting triangle with reverse alternation (b<d) which is ending soon. Take a look at bloomberg' fresh article about gold http://www.bloomberg.com/news/2012-0...mmodities.html
You...
Ignored
XAU-XAG/USD_Gold n Silver Trader's Thread = Technicals, Fundamentals & News
Joined Aug 2009
|
Status: Patience = Simplest of all skills
|7,152 Posts
OK here we go.
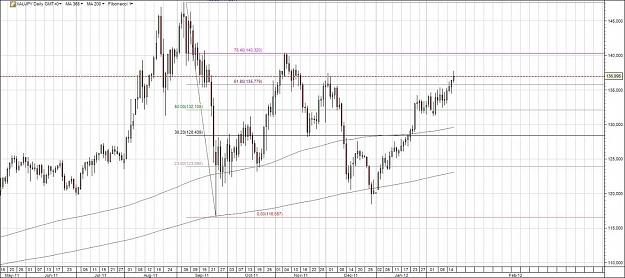
It looks like you want to see a test of my Symmetrical triangle break line - which would bring us only to 1640 before renewing move higher to hit the channel top.
Now, I mentioned this in an earlier post, if there is a test and no breach -
it then becomes even more unlikely for any decline and the price should then resume rising quickly to test an anticipated channel top of 1810 in time.
Technically your area D and line is arbitrary, there need to be 2 points to draw a line that is established. If you are just speculating sure, draw
100. Seems B needs to go to C AND THEN X then BREAK!
??? don't use ew. Not sure.
What I do know is the established line in red is broken. Bullish. Test or no test of the line the width is $450 USD of the sym T.
1650 + 450 = 2100 target on weekly - pattern over 5 months
Attached Image (click to enlarge)
XAU-XAG/USD_Gold n Silver Trader's Thread = Technicals, Fundamentals & News
Joined Aug 2009
|
Status: Patience = Simplest of all skills
|7,152 Posts
OK Its at the top - this is a D E M O - take a look and let me know.
I could make one for specifically for gold and silver for this thread.
The only problem is the leverage is a big fat 0
which means it costs a ton of margin to take a standard size gold position
essentially this does not matter cause it will be a demo, but the margin does get tied up quickly if I do a set
of say 5 standard lots... moving to homepage not enough people here....
XAU-XAG/USD_Gold n Silver Trader's Thread = Technicals, Fundamentals & News
It looks like you want to see a test of my Symmetrical triangle break line - which would bring us only to 1640 before renewing move higher to hit the channel top.
Now, I mentioned this in an earlier post, if there is a test and no breach -
it then becomes even more unlikely for any decline and the price should then resume rising quickly to test an anticipated channel top of 1810 in time.
Technically your area D and line is arbitrary, there need to be 2 points to draw a line that is established. If you are just speculating...
Ignored
In your chart, where do you see that D ? $1750 or $1790 ?
I am currently watching XAU JPY with a view to entering long, based on an expectation of the Yen continuing to lose value, and gold increasing due to the many reasons that have been discussed here recently.
I believe the recent devaluation of the Yen has been partly due to BoJ continuing their intervention efforts, but also partly due to Japan's economy continuing to struggle. If Greece comes to the party and manages to broker a deal to avoid/delay defaulting, risk will be "on", so gold should increase and the yen's function as a "safe haven" will reduce.
I will wait until usdjpy clears and retests the psychological and resistive barrier of 80 before entering the trade - once it clears this hurdle i think it will pretty much fly, so will be long both usdjpy and xaujpy (having said that, usdjpy is currently butting up against very stiff resistance, so will wait for that to clear before entering - if it doesn't clear immediately I will wait until it does ).
I will also wait for xaujpy to clear the 137 area (which has lots of traffic around it and is also a round #), but that should coincide with the usdjpy clearing 80.
Please don't follow this unless you research it thoroughly for yourselves!
NP
I am not sure of what you are saying in the below bolded line.
There are longer term bullish Trend lines as well that come in at different ranges depending on how they are drawn and what the origin is.
I am only using the past 4 years and trading on a weekly for simple analysis.
The trend is far longer as you know.
In actuality I don't like to see the price Blow Itself out of the channel too far,
because then we usually have a semi dull corrective period back to a support.
Then buying resumes.
By your chart it seems...
Ignored
Oh, sorry,
I meant that price might fall to 1550 region, but 1500 level will not be tested in near future. The lines drawn are indeed ARBITRARY 'cause there's no confirmation that wave D is completed. in fact we may see 1835 (D=162% of B) before the drop. If it's the case, wave E will end in vicinity of 1650. The channel I was mentioning is weekly channel from 2008. I'm more bullish LT but do short term trading too. BTW, cool idea about DEMO for the thread's trading purposes!
Joined Aug 2009
|
Status: Patience = Simplest of all skills
|7,152 Posts
Gotcha now. The new chart looks like a possibility.
It is actually something that concerns me for Gold's future consistent stability,
is the size and time or Length of some of the massive swings that may begin to occur if the price does not behave "most of the time" and blows itself out then to new highs then pulls back massively in a day....
Oh, sorry,
I meant that price might fall to 1550 region, but 1500 level will not be tested in near future. The lines drawn are indeed ARBITRARY 'cause there's no confirmation that wave D is completed. in fact we may see 1835 (D=162% of B) before the drop. If it's the case, wave E will end in vicinity of 1650. The channel I was mentioning is weekly channel from 2008. I'm more bullish LT but do short term trading too. BTW, cool idea about DEMO for the thread's trading purposes!
Ignored
XAU-XAG/USD_Gold n Silver Trader's Thread = Technicals, Fundamentals & News
I knew when I bought those coins a week or so ago the price was going to fall, it is an old joke among many that buy and stack physical metal.
(Once you pull the trigger the price falls to a more favorable buy in)
I'm not too worried, it was sitting in about a dollar or so range, perhaps the bearish move down will open up for a push back through the resistance at 34.5
Also note that she closed 18 cents above interim support at 33.00
could be considered bullish on H4 close with a spinning top left.
Price could trade light on Monday US..Price could trade light on Monday US "President's Day Bank Holiday" or get manipulated by the London Boyz / Thieves LOL
Welcome..
Ignored
Thanks for the welcome mate i actually am a silver stacker myself well only the last year or so and it was through this i became interested in trading so i owe a lot to silver i will fess up i was buying silver at 48 dollars an ounce thinking the sky was the limit i am glad it came down again . Now days like gold its a great safe guard against inflation and with its many industrial uses and thermal qualities should be a pretty safe long term investment well heres hoping lol
I meant that price might fall to 1550 region, but 1500 level will not be tested in near future. The lines drawn are indeed ARBITRARY 'cause there's no confirmation that wave D is completed. in fact we may see 1835 (D=162% of B) before the drop. If it's the case, wave E will end in vicinity of 1650. The channel I was mentioning is weekly channel from 2008. I'm more bullish LT but do short term trading too.
Joined Aug 2009
|
Status: Patience = Simplest of all skills
|7,152 Posts
I owe a lot to Silver as well. Silver has lots of potential as I see it. Even if Gold were to gain at a slower pace for a bit it could be silver positive.
I first bought I think the price was 15. Then I waited and we corrected to Seven something USD an OZT. Gold dipped then too to 750 / 8 appx.
It was in 07 I if I remember correctly.
I knew that was never going to be seen again.
From watching silver I also had up the four PMs / AU / AG / PT / PD
after a few years of watching price action at work and studying the past
on AU & AG at least, you become pretty familiar with how they operate.
Trading is a likely progression for you, know it's time to study why
the market moves.
It can be a different game at first from physical buying. Some buy and stack / hold/ sell / rebuy a bit.
Other guys I know just buy big loads (for a personal purchase) 100 + ozs of metal is pretty heavy too, and just flip it after making a few bucks. wait for a correction and do it again. Trading is all much faster.
Thanks for the welcome mate i actually am a silver stacker myself well only the last year or so and it was through this i became interested in trading so i owe a lot to silver i will fess up i was buying silver at 48 dollars an ounce thinking the sky was the limit i am glad it came down again . Now days like gold its a great safe guard against inflation and with its many industrial uses and thermal qualities should be a pretty safe long term investment well heres hoping lol
Ignored
XAU-XAG/USD_Gold n Silver Trader's Thread = Technicals, Fundamentals & News
I am currently watching XAU JPY with a view to entering long, based on an expectation of the Yen continuing to lose value, and gold increasing due to the many reasons that have been discussed here recently.
I believe the recent devaluation of the Yen has been partly due to BoJ continuing their intervention efforts, but also partly due to Japan's economy continuing to struggle. If Greece comes to the party and manages to broker a deal to avoid/delay defaulting, risk will be "on", so gold should increase...
Ignored
XAU-XAG/USD_Gold n Silver Trader's Thread = Technicals, Fundamentals & News