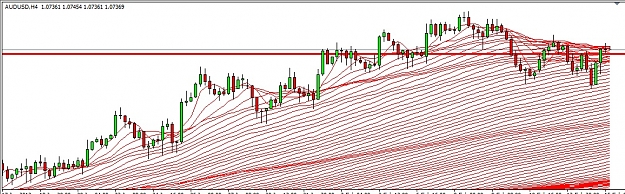
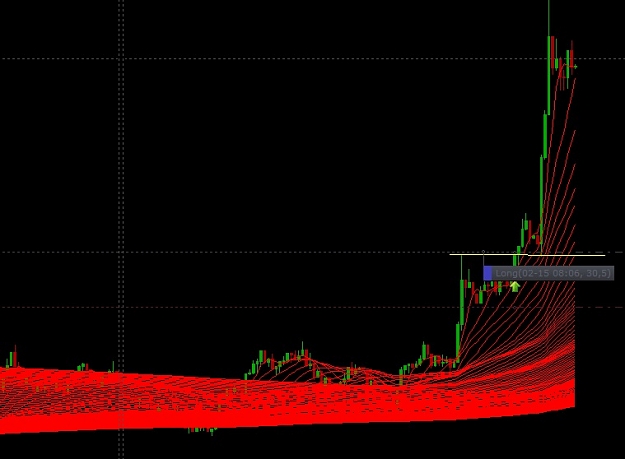
I just thought I'd put together something for USDJPY if we want to get in again,
it still looks very bullish even price now have stalled,
I think it might be the begining to something big,
from the looks of the moove from yesterday it doesn't looks to be a retracement in a downtrend anymore,
it has all the charateristics of a trend. maybe it's to early to say for sure,
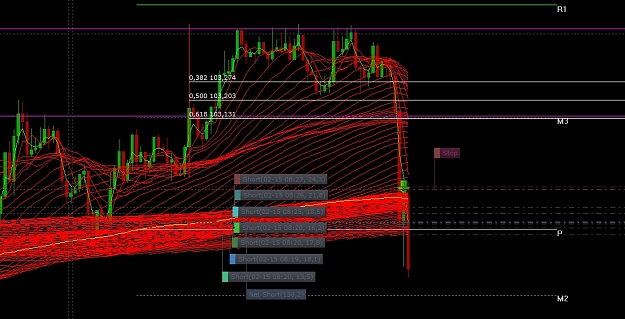
but I think it will probably continue up, what I like to see is a retrace,
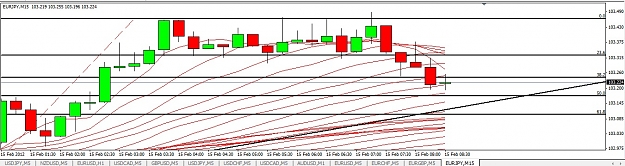
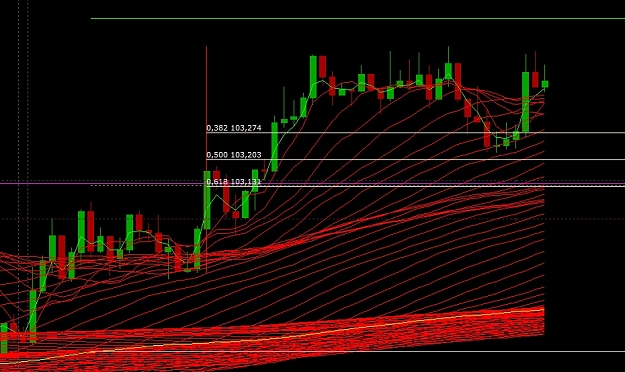
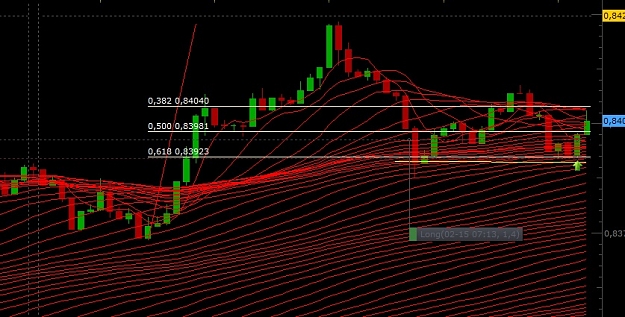
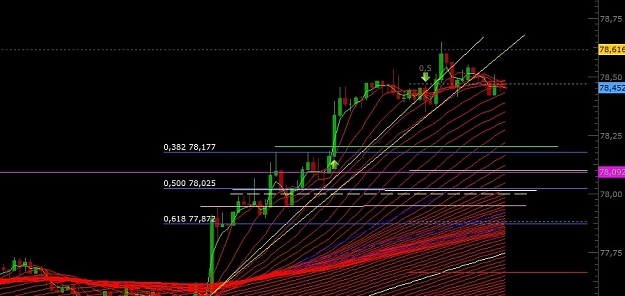
I have marked on the chart the most probable levels we can get in at.
from the looks of it I think it will go down to 50% if it will go down at all.
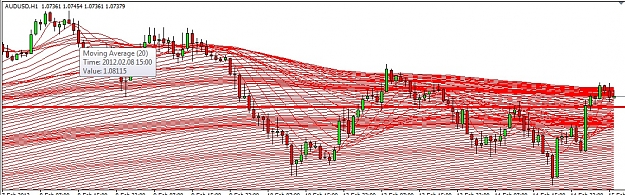
we may just see it go sideways before shoting up again who knows?
but look at the stripes I marked with blue, it looks like the place to get in is 50%
and there also is the most confluences around the 50%,
but lets wait and see whats developes when price get near, if it does at all,
we may need to update the stipes at that point, they could be further up.
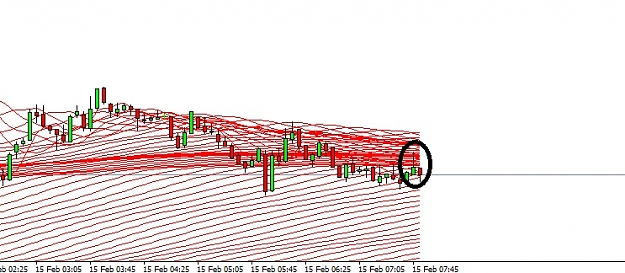
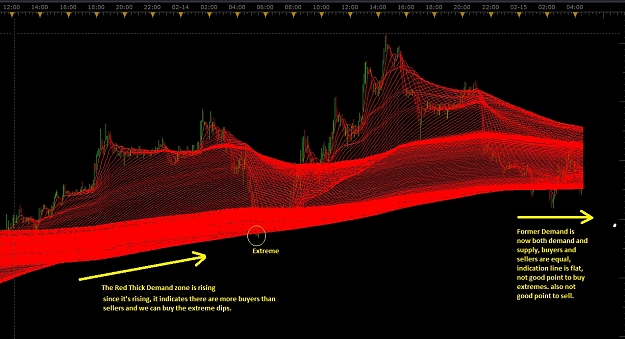
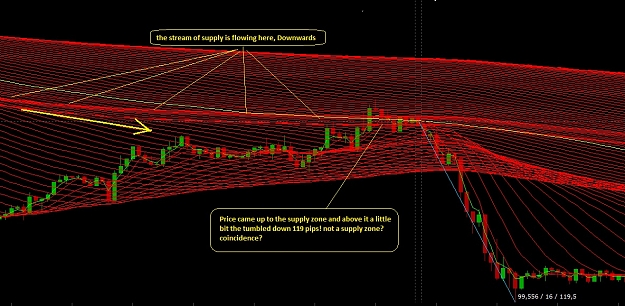
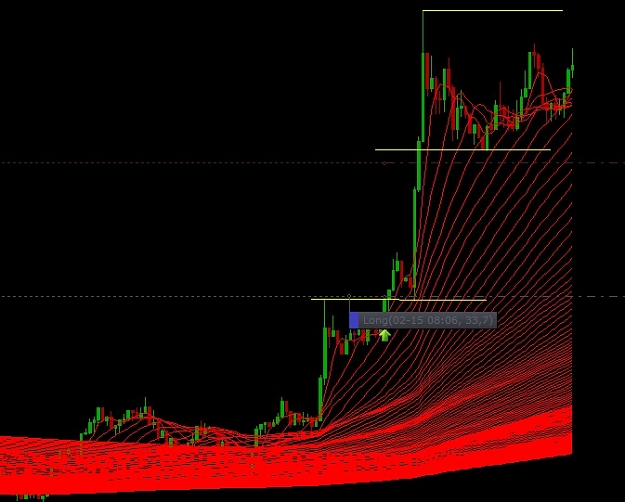
notice the red is gathering at the top.
and price has also violated the trendline,
a retrace is probable,
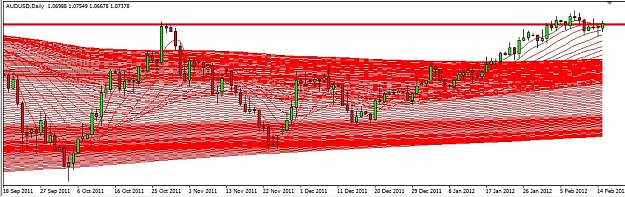
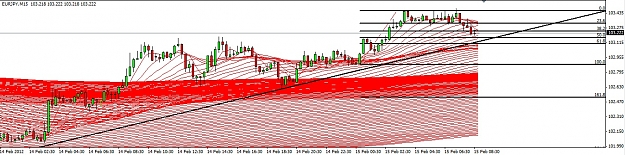
I updated the trendline, it was a little bit off,
the lowest one is the current.
the green line is old resistance which now should become support,
thats also a good place to get it. it should be pretty strong support,
and it lines up well with the 38% fib
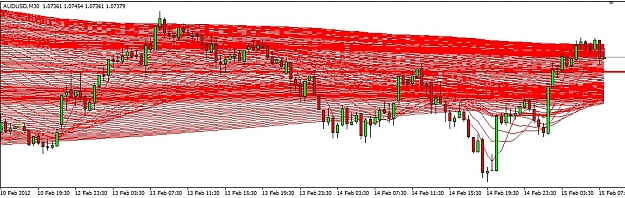
the line below 38% is the daily pivot,
below the 50% there is a minor high,
round number and another minor high.
at 61.8% nothing, I pretty much rule that one out.
take your pic
it still looks very bullish even price now have stalled,
I think it might be the begining to something big,
from the looks of the moove from yesterday it doesn't looks to be a retracement in a downtrend anymore,
it has all the charateristics of a trend. maybe it's to early to say for sure,
but I think it will probably continue up, what I like to see is a retrace,
I have marked on the chart the most probable levels we can get in at.
from the looks of it I think it will go down to 50% if it will go down at all.
we may just see it go sideways before shoting up again who knows?
but look at the stripes I marked with blue, it looks like the place to get in is 50%
and there also is the most confluences around the 50%,
but lets wait and see whats developes when price get near, if it does at all,
we may need to update the stipes at that point, they could be further up.
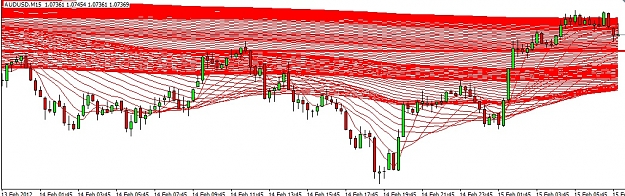
notice the red is gathering at the top.
and price has also violated the trendline,
a retrace is probable,
I updated the trendline, it was a little bit off,
the lowest one is the current.
the green line is old resistance which now should become support,
thats also a good place to get it. it should be pretty strong support,
and it lines up well with the 38% fib
the line below 38% is the daily pivot,
below the 50% there is a minor high,
round number and another minor high.
at 61.8% nothing, I pretty much rule that one out.
take your pic
Attached Image (click to enlarge)
Bulls are stupid Animals!especially when Im short!