Are you sure that your first Tp is not too far ??
The distance between SL and entry should me the same than entry TP1.
I've found a similar trade than yours and it had been a BE, not a loss.
Let me know
Ignored
My SL should be 1 pip below the low of the recent candle.
Distance between the entry point and the low of a recent candle is 3 pips.
I didn't want to say that your R/R is not right.I just said that the First TP is too far.
It's not my opinion, but the rules.
on fib, 0=Entry,1=TP1, 2=TP2...TP1 is not equal at RR2.Tp 2 is.
When the first TP is reach then you move to BE.(not tp2)
On my screenshot the same trade had been a BE one.But I personally think that Spread =3 is too much for such strategy.
Green pips to you
I have been trading this system for about 3 weeks live on a penny account and my M1 EU trades with a 1-2 pip spread are making consistent money. My trades on other currencies with 3-4 pip spreads are really struggling to keep their heads above water. I seem to have to work twice as hard at keeping those trades profitable. The SL are too far back so even though I set them to my chart to my brokers spreads, I will close them out manualy when my real fib tool SL is hit. If I let them go to the real spread SL they would have sank completely by now. In order to trade the higher spread (>2pips) I am looking at trading them on this system now with the M5 and M15 looking for more solid moves. We'll see how this goes. So far I am pleased with the method.
You're right, In my opinion the spread is the clue too. Not obvious to manage the trade with spread and to respecte the rules in the same time with 3pips spread.
Would you please share your settings on higher timeframe.?
Thanks
I have been trading this system for about 3 weeks live on a penny account and my M1 EU trades with a 1-2 pip spread are making consistent money. My trades on other currencies with 3-4 pip spreads are really struggling to keep their heads above water. I seem to have to work twice as hard at keeping those trades profitable. The SL are too far back so even though I set them to my chart to my brokers spreads, I will close them out manualy when my real fib tool SL is hit. If I let them go to the real spread SL they would have sank completely by now....
The first trade should have been moved to BE as soon as 1R was reached in my view.
You could have filtered out the 3rd and 4th trades by entering the trades at 1 pip beyond the break of the entry candle. I am not suggesting that we optimise the entry necessarily - but entering on the break of the 'entry' candle is a pretty standard variation on the current method of entry.
I made an EA for this strategy and backtested results (1 year) show that it is a loosing system.
Ignored
Did you only trade the London in your testing?
I quit trading this each day after 2 or three losses - and dont trade any longer after i have made 1.5-2R+. I have found using this form of trade management keeps the system profitable for me.
At this point I have just started the higher time frames and had planned on using the same settings I have for the M1 and see how it goes unless there is an obvious bad reason for doing so that I have missed.
The other thing I want to add is that I dog the trades once they are on. AS soon as trade crosses TP1 I set BE+1, as soon as trade passes TP2 I set stop to TP1. TP3 seems to be a stretch at this time frame so I start whatching the candles for signs of exhaustion and/or stochastics reaching the extreme again and turning against me. I basically try and milk each trade but I don't let a winner ever become a loser. I haven't ever met a positive pip trade I don't like and with this system there are lots of opportunities to jump on board and find the next wave that goes farther than you expected so there is no need to get greedy.
You didn't wait for the candles to close with the stoch closing in the gray before you entered, .
Ignored
If you look only to color you could be mislead. Someone complain before that the indicator repaints. If you consider color it does repaint. It you consider values (thats what matters. right?) it doesn't changes/repaints.
Consider the following
Stoch alone bellow 20. (Above 80 its the same logic)
whenever the Stoch drop bellow 20 on candle close the last line segment becomes red.
If the value goes up 20, the last line segment will be gray. But if the next value goes again bellow 20, we'll get another last red segment. (an inverted V with the edge above 20).
So color has nothing to do with Joao's entries. I believe he followed the "rules" and at entry time the line was GRAY.
When we look back and see a good setup with obviously a gray line going up it was kind of "luck". this time it went up!! It worked!!
Whenever Stoch crosses bellow 80 or above 20 and the other indies line up, you have a trigger. It doesn't mean it will work every time. But in this timeframe you can't wait to much. You either pull the trigger or you back off.
A lot of discretion is still needed.
Like every other system out there if one follow rules blindly it will loose in the end.
Ignore color and pay attention to numbers and what is happening in higher tf.
If you look only to color you could be mislead. Someone complain before that the indicator repaints. If you consider color it does repaint. It you consider values (thats what matters. right?) it doesn't changes/repaints.
Consider the following
Stoch alone bellow 20. (Above 80 its the same logic)
whenever the Stoch drop bellow 20 on candle close the last line segment becomes red.
If the value goes up 20, the last line segment will be gray. But if the next value goes again bellow 20, we'll get another last red segment. (an inverted V with the edge...
Hi Rohule, thanks for the links. Looking forward to attach it since I think I have to analyze the higher timeframe before making decision whether to enter position or not.
Regards
Always Set Stop Loss !! Trade what you see .... Not what you think !!
I've been looking at this strategy with great interest - and also some small degree of amazement at some of the deals which have been posted up here!!
There have been many examples of deals which don't follow the rules.
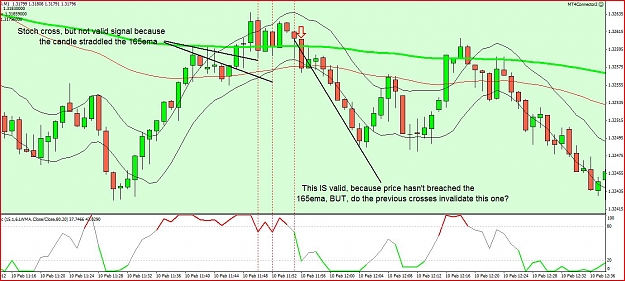
The most common ones are when [using a short deal for my example] the lower band is above the 165ema and also when the trigger candle isn't FULLY ABOVE the 165ema.
If either of the conditions above are true, there is NO TRADE!!
However, I have a question for Paulus:
On the attached chart from today, there are several stochastic crosses which are invalidated by the trigger candle breaching the 165ema.
However, we then get a stoch cross on a candle which DOESN'T breach the 165ema, so would that be a valid trade?