Any mathematicians able to help out here? Stats have never been my finest point so...
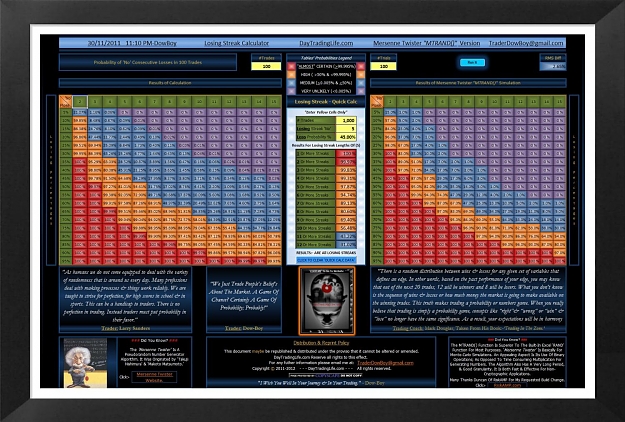
Probability of a losing streak is, in Excel speak:
=(1+(n-s)*p)*(POWER(l,s))
where n=number of trades, s=number of losing streaks, p=probability of winning, l=probability of losing.
Ok, so say I have a strat 23% successful over 220 trades, I get figures like this (written number of losses followed by probability)
10 361.21%
15 95.49%
20 25.23%
25 6.66%
30 1.76%
... something is amiss - 361%?? Any ideas?