So this is a test chart to see whether people can understand my entries and exits I post.X-man, Let me know if it is good enough so I can post more.
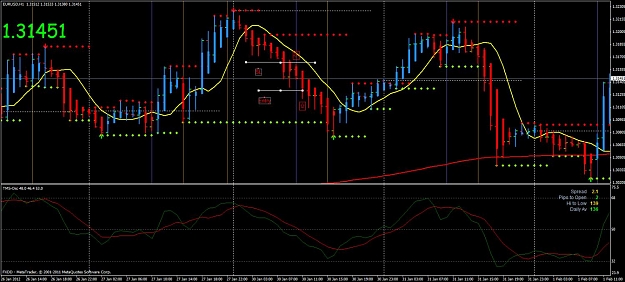
So here the trade. SL is above the candle marked with a down arrow. Entry is when the candle appeared to break the resistance area or what some might call the 1 2 3 pattern. I entered. Price moved down 25 to 30 pips. At that time I moved my SL to BE and got hit. Only to see it go down more. I recall phx62 mentioning he moved his SL to BE everytime price moved this much.
TP was 50 pips. But here is the thing. I am somewhat nerous with the TP as I am not sure it will hit. As in not sure HOW to watch for levels of penetration or stalling. What is a strong level. What signals to let the trade run.
Attached Image (click to enlarge)