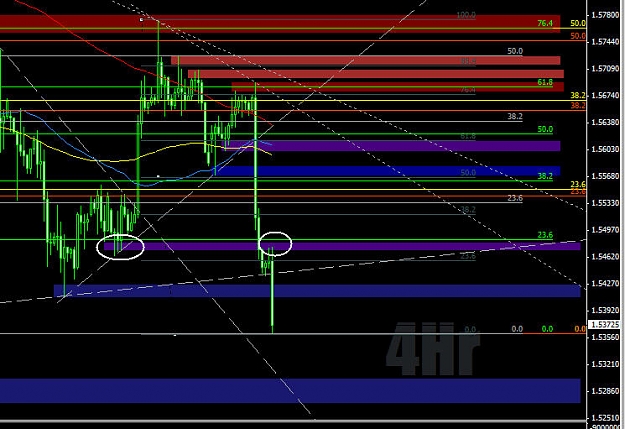
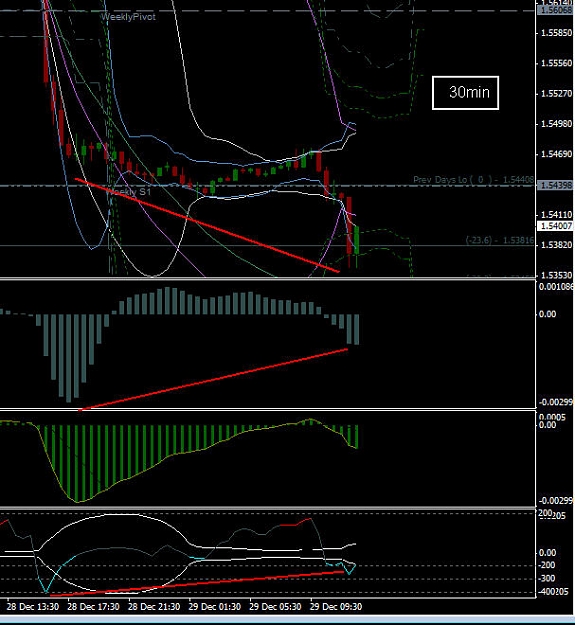
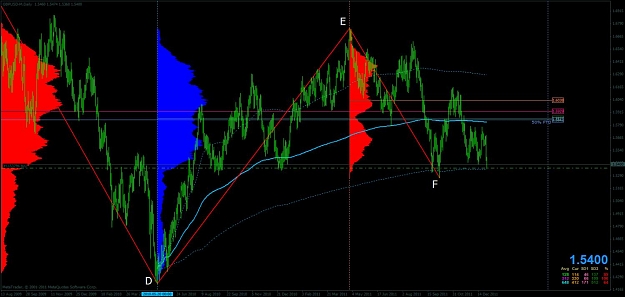
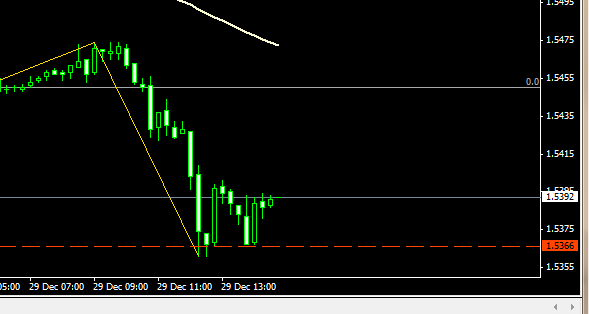
I refer you to the daily chart I posted above...it shows yesterday's daily bearish thrust candle and the now breeched ascending daily trend line as well as the previous daily swing lo @ 5409 that was co-existant as a minor weekly swing lo too.
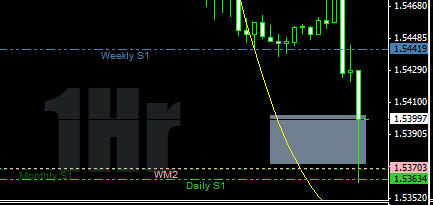
Price testing Daily S1/area of Monthly S1 now.
G/L
Price testing Daily S1/area of Monthly S1 now.
G/L
ex member