Dislikedtwo comments.
First, it's clear there can be significant differences in the daily charts depending on the time zones. I use gmt +2 which is beneficial for a number of reasons (e.g., the day/week starts when the market opens on Sunday/Monday). That said, on my daily chart there was a downward slope on the blue (2 MA) line, when you made your trade. For me that would have put up a big flag about the trade.
Second if you look at the H4, there is clearly a significant downward slope on the MA 8. Again, this should limited your enthusiasm for a long...Ignored
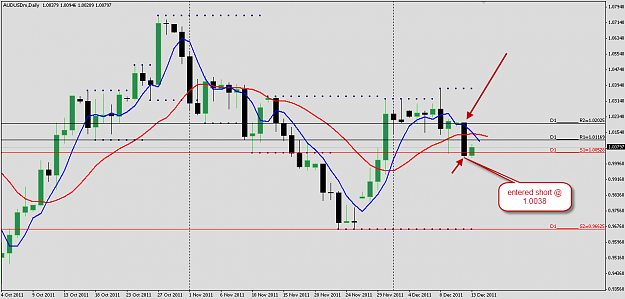
I entered short @1.0038 just below the red D1 support line.
This is the reason I am posting this and trying to figure out want went wrong (the price went long). I would like to learn what mistake I made.
Maybe I didn't spot some S+R level on lower time frame...
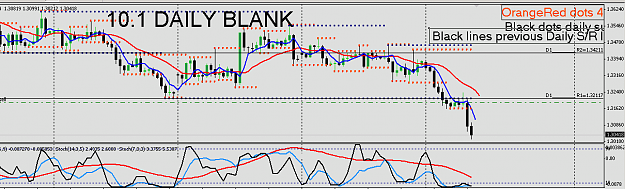
Attached Image (click to enlarge)