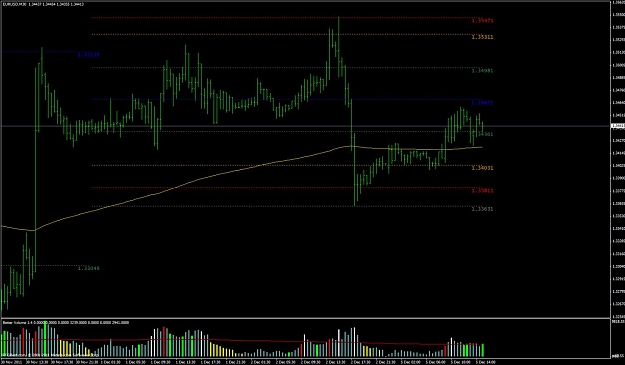
looks like there is a break to the downside. next level to be tested is weekly support - weekly pvp (~3320) and vaL (~3226) atm. until we see these levels, i'll be looking for shorts from the daily vaH (that is, from the purple area).
just an example of what can be done with dynamic value indicator - nothing new in terms of trading principles, just using a more accurate tool.
blue areas are dyn val for last 24 hours; 70% of the activity occurred within this channel - works like a charm for trading inside the channel or when price is ranging... just buy at lower limit, tp / sell at upper limit. or adjust accordingly based on higher tf trend.
my trade for today - buy@3426, [email protected], tp@3480 (weekly points up, it's already trading above weekly dynamic value - not shown here)....
Joined Mar 2010
|
Status: Moved to futures
|477 Posts
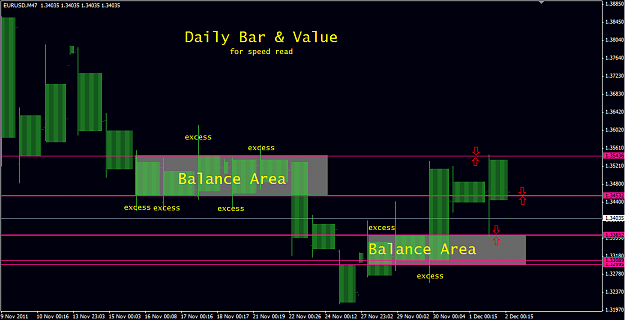
This was an inevitability.
Return to the spike base from 11.29 rally.
Aqua lines drawn 11.29 as potential targets for a pullback.
Grey line was support from balance 1.5 weeks ago.
Blue lines were distribution gaps from 11.22
The spike in e period (11.29) was left behind too quickly. The market never had a chance to "use" price there (facilitate trade) effectively. It was bound to return there at least for a short time to seek more information about that zone.
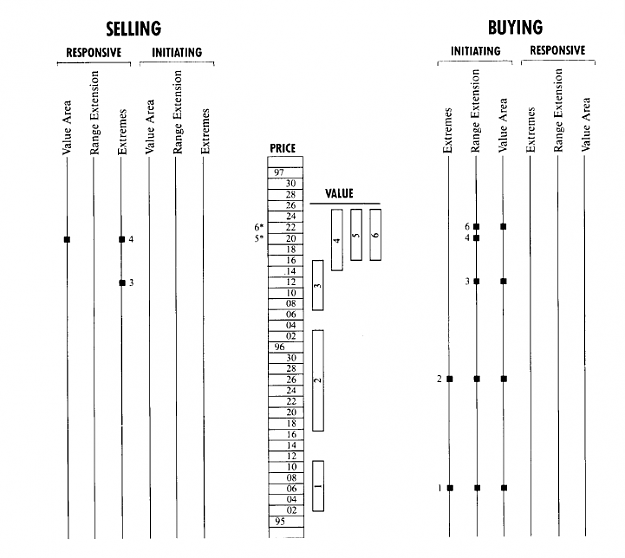
Ya know, Bandung, the cbot guide to using the mp graphic has a segment on charting only value areas.. Did you read it or are you a dang psychic?
Lol
Ignored
I think he's charting the value areas...similar to the way I do it as well. If you break your TPO down into sessions and use the value of the last few sessions as a BO zone, it can be quite helpful.
I think he's charting the value areas...similar to the way I do it as well. If you break your TPO down into sessions and use the value of the last few sessions as a BO zone, it can be quite helpful.
Regards,
NeoRio
Ignored
I know.
In the CBOT's guide to using Market Profile they have a section on charting only value areas. I was just trying to make a funny.
Fantastic...Peter Steidlmayer fully exploited standard deviations(1st 2nd 3rd standard deviation and excess...) as an end product of market profile...
Ignored
I don't understand the point?
Market Profile is described by Peter Steidlmayer as similar to a bell curve with the 1 and 2 standard deviations. Terminology is relative I suppose. I often find myself referring to VAH and VAL as "retail prices" and "wholesale prices".
Heck, there's even a portion of his book where he explains one does not need the MP graphic and that the Auction Market Theory principals are what is important. The graphic is just a way to visually display data.
|
Joined Mar 2011
|
Status: try and fail but don't fail to try
|289 Posts
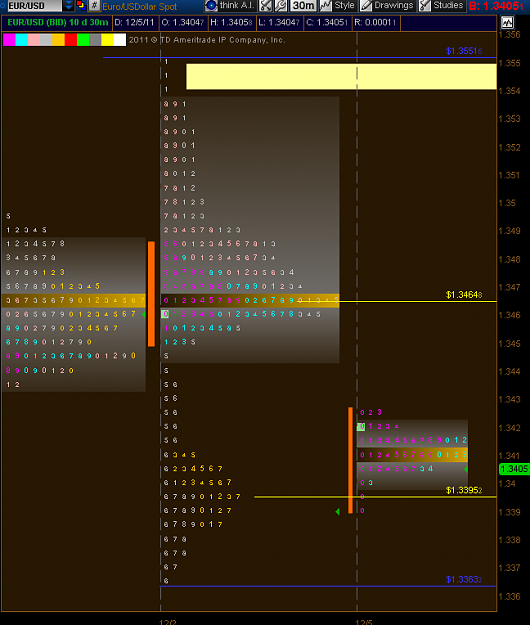
i just bought at 1.3405 after daily IB was established (i take 7h after us close) and failed to auction lower then the POC of friday's second distribution. half of position has the stop at lower low of IB/the second stop is right below TPO nr 3 which tested the friday's close. my entry was made after SV from 5 min chart...after the friday's action we should see today some auction rotation in order to facilitate the trade further
i just bought at 1.3405 after daily IB was established (i take 7h after us close) and failed to auction lower then the POC of friday's second distribution. half of position has the stop at lower low of IB/the second stop is right below TPO nr 3 which tested the friday's close. my entry was made after SV from 5 min chart...after the friday's action we should see today some auction rotation in order to facilitate the trade further
Ignored
Pretty good read & RR for this trade...u still hanging on?
A pullback entry right onto DVAL after much of auctioning to balance during UK which i manage to find this opportuinity during the H period. Prior to UK, TK failure to RE lower provided a hint.
Initial risk was 13p with exposure reduce for a 49 points right on Fri's POC. This corrective move could stop right onto 79% fib level of this swing or @3500....