Had a look at the charts. Nice trades. Quite a few H4 setups occurred in the Asian session which fits with you being in China I guess NBob?!
I like the way that you ID the trend on the daily and drop to the H4 and look for a bounce off the orange H4 S/R lines. So in short, you are looking for CT rallies on the H4 to trade back with the trend on the daily?
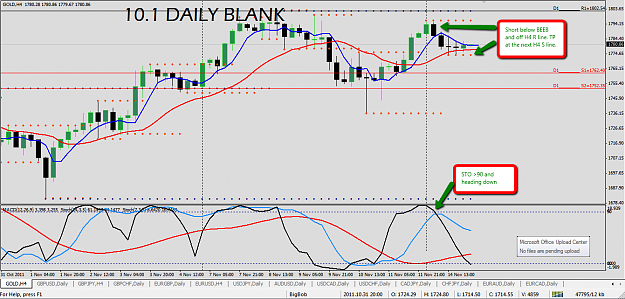
There was a small CT trade on H4 gold using this method today. Rally into the H4 R, bounce off (below the daily black lines too) and the STO was >90 going back down. The trade would have been closed at the H4 support below for 20 or so pips, depending what price you got in at. This was a CT trade (on demo) that was CT to the daily but was a play back towards the daily red line (8MA).
"The main point of Relative Vigor Index Indicator (RVI) is that on the bull market the closing price is, as a rule, higher, than the opening price. It is the other way round on the bear market. So the idea behind Relative Vigor Index is that the vigor, or energy, of the move is thus established by where the prices end up at the close. To normalize the index to the daily trading range, divide the change of price by the maximum range of prices for the day. To make a more smooth calculation, one uses a symmetrically weighted moving average of the differences of the closing and openings prices, as well as maximum and minimum prices of the bar.
The best period at calculation of the indicator is considered 10. To avoid probable ambiguity one needs to construct a signal line, which is a symmetrically weighted moving averageof Relative Vigor Index values. The concurrence of lines serves as a signal to buy or to sell.
Calculation
VALUE1 = ((CLOSE - OPEN) + 2 * (CLOSE (1)) – OPEN (1)) + 2*(CLOSE (2) – OPEN (2)) + (CLOSE (3) – OPEN (3))) / 6
where:
OPEN — is the opening price;
HIGH — is the maximum price;
LOW — is the minimum price;
CLOSE — is the closing price;
VALUE1 — symmetrically weighted moving average of the differences of the closing and openings prices;
VALUE2 — symmetrically weighted moving average of the differences of the maximum and minimum prices;
NUM — amount N importances of VALUE1;
DENUM —amount N importances of VALUE2;
RVI — value of the Relative Vigor Index indicator for the current bar;
RVISig — value of the RVI signal line for the current bar;
N — period of the smoothing."
Had a look at the charts. Nice trades. Quite a few H4 setups occurred in the Asian session which fits with you being in China I guess NBob?!
I like the way that you ID the trend on the daily and drop to the H4 and look for a bounce off the orange H4 S/R lines. So in short, you are looking for CT rallies on the H4 to trade back with the trend on the daily?
There was a small CT trade on H4 gold using this method today. Rally into the H4 R, bounce off (below the daily black lines too) and the STO was >90 going back down. The trade would have been...
Ignored
I didnt become a profitable trader until I started trading the 4H charts. The guys who taught me and I followed used the 15M charts sometimes with 1H reads and all I did was get killed there. I called it SL heaven. Now that I have added daily and weekly reads my win percentage is consistently hitting 80% and higher and my account increase averages over 10% a month. You simply cant trend trade without looking at high end charts. You will get whiplashed all day long if you dont.
4H charts fit my lifestyle perfectly because I can read a candle at beginning of JPY (morning when I get up), before Euro (my lunch time) and then mid euro (school is out). The next one is at the beginning of USA session (just after dinner), then the middle of USA session (just before I go to bed). I get up in the morning and start all over again. So 4H candle trading fits my schedule perfectly and interferes least with my family and work life.
So I have gotten good at 4H reads confirmed with daily and weekly reads. I like this business.
"The main point of Relative Vigor Index Indicator (RVI) is that on the bull market the closing price is, as a rule, higher, than the opening price. It is the other way round on the bear market. So the idea behind Relative Vigor Index is that the vigor, or energy, of the move is thus established by where the prices end up at the close. To normalize the index to the daily trading range, divide the change of price by the maximum range of prices for the day. To make a more smooth calculation, one...
Ignored
That could go with my bubble trade I am using with counter trading. I found a reversal signal doing something with daily open versus price action. Wish I could talk to you about it before posting it though. I will match its read with this one and see how they compare. It then would replace the 6ths indicator for CT trade reads.
The bottom line is I am finding all sorts of uses for Squalou's S/R indicator. Dang what a great piece of work that thing is. I wish FF could give him a medal or something.
... I wish FF could give him a medal or something.
Ignored
He is indeed one of the most intelligent traders here in FF and we are very fortunate to have the likes of him and your good self here. I am very flattered you wish to discuss something with me and I am at your service. Mind you I am NOT sure how I can contribute with my very limited knowledge. If you are busy during the week we can chat during the weekend. During the week the best time for me is 12:00 to 16:00 GMT which is your evening.
|
Joined Dec 2010
|
Status: Swings and Breakouts
|413 Posts
I place a buy limit 3days ago above the R line and was triggered yesterday. TP should be slightly below the black dotted line (2.0568) but I missed it already.
Should I TP now and set another Buylimit above the Daily R2?
I place a buy limit 3days ago above the R line and was triggered yesterday. TP should be slightly below the black dotted line (2.0568) but I missed it already.
Should I TP now and set another Buylimit above the Daily R2?
Thanks for your advice
Ignored
Yes I would I believe it just hit a triple top on the daily and I am playing it to bounce yet a third time back down. So ............. grab profit while you can. I would then put a buy on the other side to pick up if it continues.
Hey Bob, This 10.1 instruction is VERY precise and clear to understand. I Liked it!
I notice your charts and mine have different D1 SR lines even when we are in same TF. Is this due to broker server locations or something else?
Ignored
Yes some brokers run GMT +1 GMT -1 etc. That will give you different open and closing of candles. Also different brokers use different banks for service so the highs and lows may register some differences between them.
So I have been running the 10.1 since Sunday but just paper trading so far, I will try to upload the excel sheet tomorrow, since I about to go to sleep. But by what I can see it has been a promising method, just trading of Squalou`s indi every pair, except one, I have opened made a profit from a minimum of just 10 pips up to past a 100 pips. Now this is just trading off the indi and not using the MA or the MACD, so this should weed out the bad trades even more and increase the false entrys which would have made me exit early.
Must say this system has a lot of promise cannot wait to put more time into it. I also want to start moving to the 4H charts to see if I can see better entrys and use the daily to confirm.
Just put in SL. The D1S1 is very far below, I will let PA float down abit. Bob, u rekon to TP now or later?
Ignored
I had the same trade going and I have already taken the profit on it. I guess it depends on your patience. I am not the most patient trader, when I see profit I like to grab it. However, the Euro is sinking, how far I dont know. I just set my final trades for the day and I am going to watch a movie now.
Hello All and Hello Bob,
This is probably the first of it's kind indicator which repaints and which I have started to build a little faith in. However, since time is mostly an issue, I have not been able to follow the whole system properly. Also a reason for it is I could not find the file where the system is documented. I read In the last couple of posts a member mentioning about the newly well documented file for the same. Please direct me to it. A request. I got to this thread through the reference of Steve's thread where he's made an EA based on one of your systems.
Hope to give additional inputs once I'm better acquainted with the system. One USP I already see I the max TP potential. One line to another, price bounces off quite precisely.
Thanks & Regards, McNish.
There is no such thing as LUCK ! Chance favors the prepared mind.
Hello All and Hello Bob,
This is probably the first of it's kind indicator which repaints and which I have started to build a little faith in. However, since time is mostly an issue, I have not been able to follow the whole system properly. Also a reason for it is I could not find the file where the system is documented. I read In the last couple of posts a member mentioning about the newly well documented file for the same. Please direct me to it. A request. I got to this thread through the reference of Steve's thread where he's made an EA based...