Everyone, this is one of my first ichimoku approaches, it could be horribly wrong please do not overvalue this approach!!
Okay, I will dare to try. I have usually studied the Ichimoku system so I have looked at a 4h chart and just followed the analysis the system. I hardly see anyone using Ichimoku here.
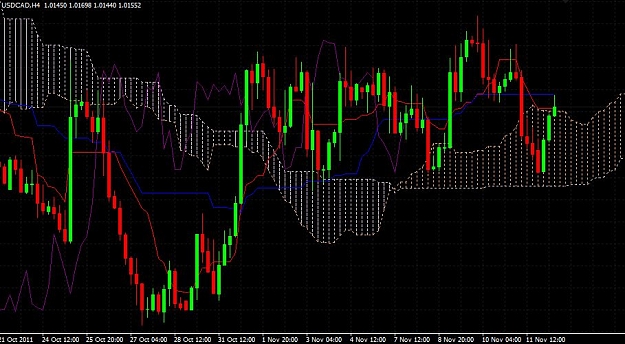
So this is just practice, I have attached a plain candle 4h chart with the ichimoku. I have a seperate window for RSI, MACD and Stochastics:
Ichimoku Analysis in 4h Chart:
Tenkan Sen (red line) is below Kijun Sen (blue line)
The Tenkan Sen line has corssed the Kijun Sen from above wich usually gives a bearish signal.
As the Cross was above the Kumo cloud however it is supposed to be a weak signal. If the USD
would however increase further a strong buy signal would be created.
Kijun Senn Cross
Kijun Senn is going to cross the price from top down wich could be assumed to be a bearish Signal.
However it is a weak signal again as the event takes place slightly above the Kumo cloud.
Chikou (purple):
Chikou (minimally) crosses the price from below above the Kumo Cloud which would give a bullish signal.
However the cross was very recent and if price falls back it would turn bearish fast.
As it is at the edge of crossing I am not sure whether it can be actually considered as a bullish signal.
Senkou Span:
No current crossever of the Senkou Spans.
Okay, I will dare to try. I have usually studied the Ichimoku system so I have looked at a 4h chart and just followed the analysis the system. I hardly see anyone using Ichimoku here.
So this is just practice, I have attached a plain candle 4h chart with the ichimoku. I have a seperate window for RSI, MACD and Stochastics:
Ichimoku Analysis in 4h Chart:
Tenkan Sen (red line) is below Kijun Sen (blue line)
The Tenkan Sen line has corssed the Kijun Sen from above wich usually gives a bearish signal.
As the Cross was above the Kumo cloud however it is supposed to be a weak signal. If the USD
would however increase further a strong buy signal would be created.
Kijun Senn Cross
Kijun Senn is going to cross the price from top down wich could be assumed to be a bearish Signal.
However it is a weak signal again as the event takes place slightly above the Kumo cloud.
Chikou (purple):
Chikou (minimally) crosses the price from below above the Kumo Cloud which would give a bullish signal.
However the cross was very recent and if price falls back it would turn bearish fast.
As it is at the edge of crossing I am not sure whether it can be actually considered as a bullish signal.
Senkou Span:
No current crossever of the Senkou Spans.
Attached Image (click to enlarge)