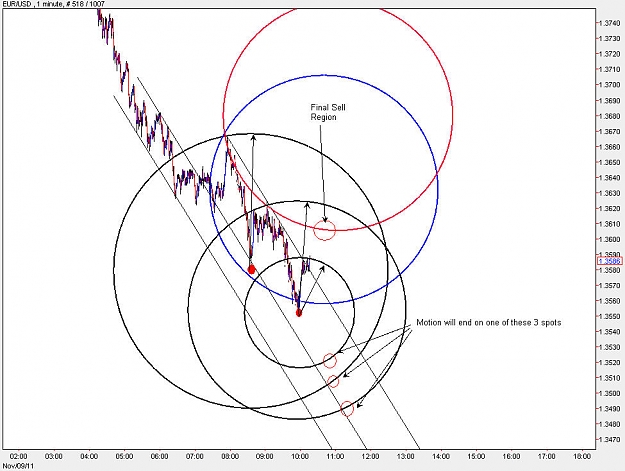
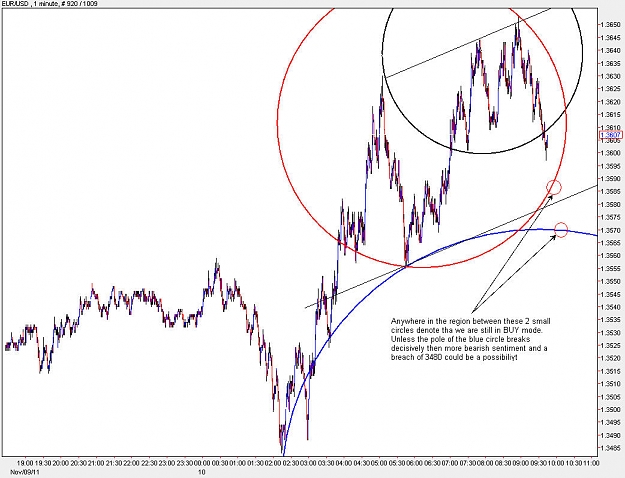
It will land on one of the circles. The real landing spot might slightly be offset, but will be along one of the curves shown. so that is somewhere in between 3480 and 3520 on one of those curves.
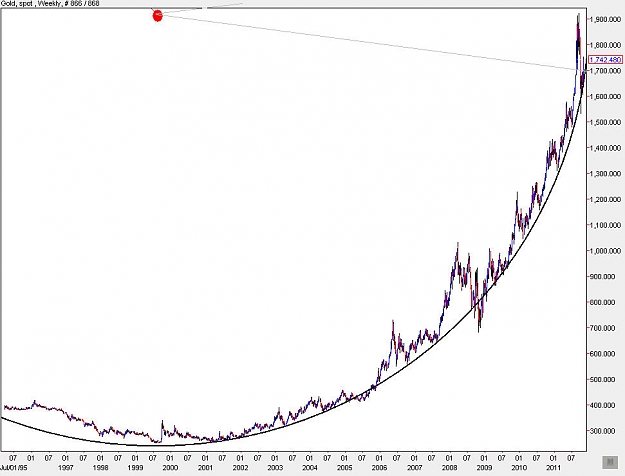
I will do it on Friday Morning. Somebody else asked me the same question too. But overall Gold has reached its limits of the up move. That is clearly shown by the weekly chart, where its reaching the weak area of the circle, and the pattern of breakout off the circle is very similar in many other ones that I have seen.
As for the smaller time frames, I will do them by Friday. If sooner, I will PM you. Infinitus on "Spider's Den" also asked me to do it. So now I have to
|
Joined Nov 2011
|
Status: Everybodys A Central Banker Here...
|819 Posts
Hello everyone. I just happen to be looking at the Murrey Math lines on this daily AU chart. Old support New resistance. yada yada yada... But mainly I wanted everyone to be aware of the perfect circle that has held up really well in the past.
A buy here COULD be a longer term position trade with a relatively tight stop & offer a nice 3 or 4:1 Risk Reward. One will definitely need to be handy with the steel in on this one utilizing several different TF's to find optimal entry. And it might take more than one attempt on this one but the longer term outlook could be good. Not to mention the nice positive swap one would earn as well on a 20-30 day trade.
This could turn out to just fall completely apart in the next few days with the EUR unraveling giving the Dollar a nice boost across all pairs but what the hey. What we have here folks is confluence. Could be time to go all in on a real trade with real $$.
Hello everyone. I just happen to be looking at the Murrey Math lines on this daily AU chart. Old support New resistance. yada yada yada... But mainly I wanted everyone to be aware of the perfect circle that has held up really well in the past.
A buy here COULD be a longer term position trade with a relatively tight stop & offer a nice 3 or 4:1 Risk Reward. One will definitely need to be handy with the steel in on this one utilizing several different TF's to find optimal entry. And it might take more than one attempt on this one but the longer...
Nice chart, looks like the pole break downward was a false break, because it had a hard rebound upwards.
Ignored
Yup. Nice V bottom bounce Exactly off the old Resistance. These moves are really holding true to form here. The pair is looking really symmetric & determined. The more I look at the more solid it appears.
Hello everyone. I just happen to be looking at the Murrey Math lines on this daily AU chart. Old support New resistance. yada yada yada... But mainly I wanted everyone to be aware of the perfect circle that has held up really well in the past.
A buy here COULD be a longer term position trade with a relatively tight stop & offer a nice 3 or 4:1 Risk Reward. One will definitely need to be handy with the steel in on this one utilizing several different TF's to find optimal entry. And it might take more than one attempt on this one but the...
Sorry stevebalmmer. The middle yellow line is illustrating an old are of resistance that is also highlighted with the blue rectangle. I was only showing how the pair is moving very deliberately over a LONG period of time. Keep in mind This is a Daily chart zoomed out the Yellow line example goes back to early 2010. And as you can see when price came back to that level again almost 2 YEARS later it bounced completely back up .
We are looking at a similar setup here where price is at an area of OLD resistance in the other blue rectangle higher up which is Jan of this year.
The entry on a bullish outlook would have you enter somewhere close to the level where price is trading now. The smaller circles illustrate touches of this level in the past. Koom's circle trendline further supports the area. The 50% FIB of the last move up is a 3rd element of confluence. And the targets are LONG. The first would be the Most recent Highs and above which are anywhere from 800 to 1000 points.
Bottom line is Something WILL happen here. If price does not bounce and continue with the longer Trend upwards It will fall through the Murrey line, through the FIB, through the circle & then use these levels as resistance to continue down.
|
Joined Nov 2011
|
Status: Everybodys A Central Banker Here...
|819 Posts
with a look at the 4H chart I think I will wait for a price action signal on this chart for a trigger. It looks too much like a H&S reversal pattern to just jump right in at this point.
Right now at the close of New York session, dont see any signs of a up move to happen before the region of 3420-3460 gets hit. If a retracement is to happen it will go at a maximum of 3630 from the 3400 region.
I am not posting charts on lower time frame yet, for the reason that I need to confirm few key behaviour at the 3510 region, and that is whether a rebound upward will occur to 3560-70 region from there.
For now I see motion going down to 3400 and up to 3600.
Good Morning Sir, its 9:30 AM Toronto time, and here is your forecast for the day:
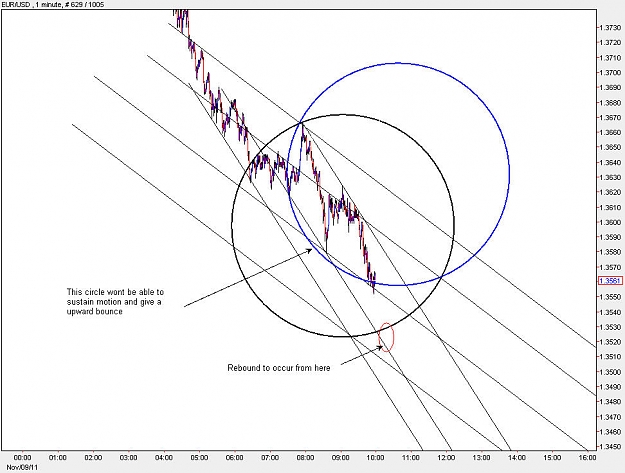
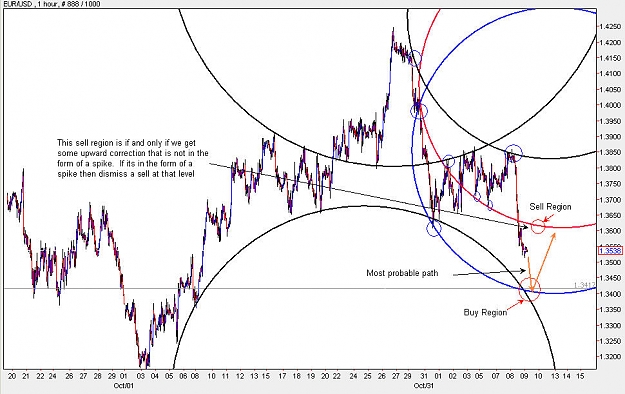
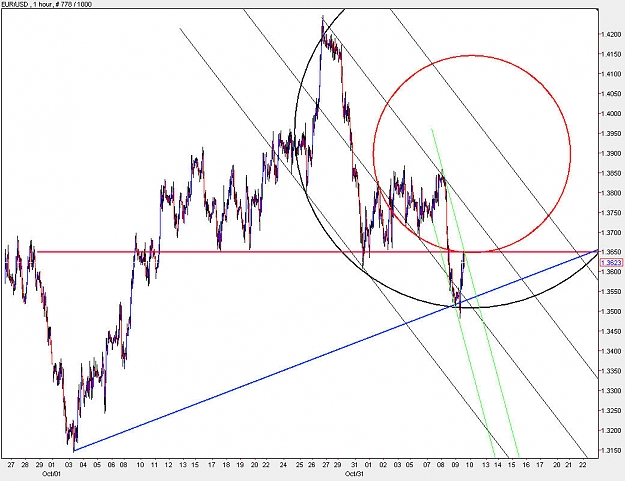
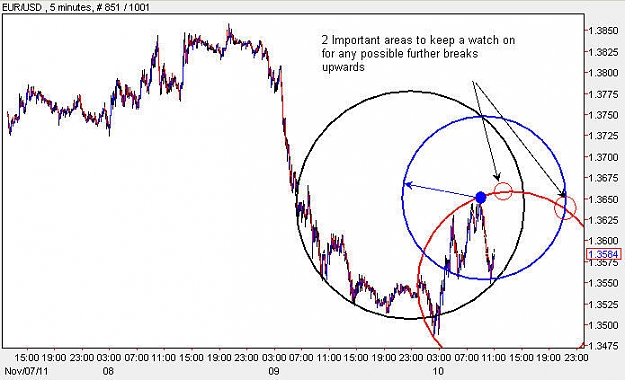
In order for the uptrend that has started from the low of 3480 to sustain itself it needs to stay above the Blue Straight Trend line. The 3650 upward movement is a visitation to a previous support, but its also at the pole of the red circle, which needed quite a bit of power from 3850 region to be broken. Meaning that its a hard area to break through and go upwards.
There are 2 choices that the EUR has at the moment. Either it has to really push itself upwards above 3650 with ease, which in that case it means that we should be at the 3720 region very quickly.
If that does not happen, then the pole of the black circle becomes the best choice to get a bounce and generate momentum to go higher. In that case we should see more than one visit to the blue line / black circle region.
At the moment the fact that we have not gone significantly above 3650 region, imposes a continuation of a bearish stance. Also noting the way that the green lines are showing a maximum upward motion being reached, is bringing into possibility the possibility of a fake upward thrust.
We need to wait till 10:30 to see what happens.
If a relative high around 3650-3660 is seen again, then a sell would be the prime choice.
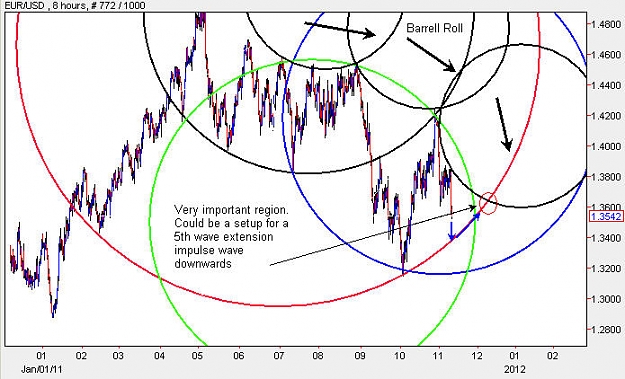
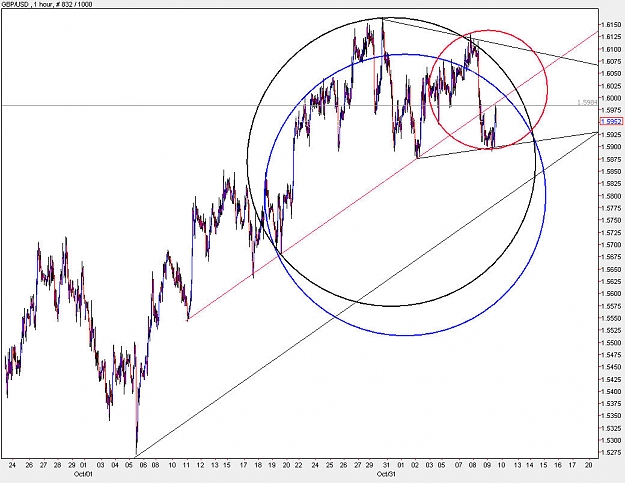
There does not seem to be enough of a bounce upwards from 5900 to go considerably above the red line at the moment.
Given the fact that we could be in some sort of a triangle between 6100 and 5900, it is making it hard at the moment to choose a direction, because both sides have almost equal probability of happening.
The best way to trade this setting is to go for a buy at the pole of the red circle and sell at the perimeter of the blue circle