I am starting this thread because I don't think there is enough discussion about how market structure can help you read the markets. A lot of threads talk about trading naked or indicator free - but some people (myself included) need some visual clues to help in reading price action.
I know different people have different definitions of what market structure is, but for the sake of this thread we are going to say market structure consists of Higher Highs (HH), Higher Lows (HL), Lower Lows (LL) and Lower Highs (LH). Now these are not really indicators but rather patterns - so if you are a purist, you can utilize market structure and still trade indicator free.
Looking at a chart you can "read" how strong an up trend is by viewing a string of HH's and HL's - void of LL's & LH's. Reverse for a downtrend.
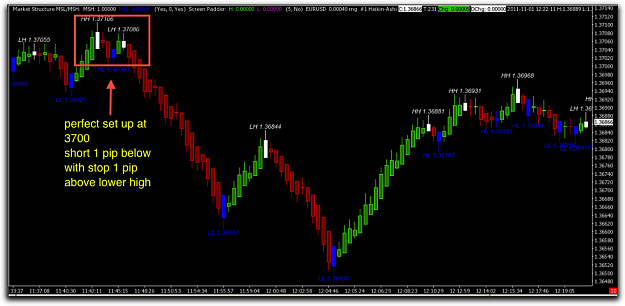
The above chart shows two trades that I took today. In the next few posts I will explain how to observe the set-up and jump in for some low risk high probability trades.
I know different people have different definitions of what market structure is, but for the sake of this thread we are going to say market structure consists of Higher Highs (HH), Higher Lows (HL), Lower Lows (LL) and Lower Highs (LH). Now these are not really indicators but rather patterns - so if you are a purist, you can utilize market structure and still trade indicator free.
Looking at a chart you can "read" how strong an up trend is by viewing a string of HH's and HL's - void of LL's & LH's. Reverse for a downtrend.
Attached Image (click to enlarge)
The above chart shows two trades that I took today. In the next few posts I will explain how to observe the set-up and jump in for some low risk high probability trades.