When price on a PnF chart breaks lower isn't it a sell signal?
I'm just referring to the charts here: http://www.investopedia.com/articles.../03/081303.asp
How do you read them the opposite way?
PB
I'm just referring to the charts here: http://www.investopedia.com/articles.../03/081303.asp
How do you read them the opposite way?
PB
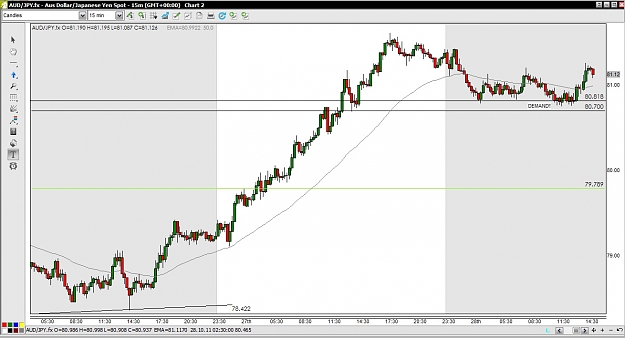
DislikedRecent trade on NZDJPY 1H.
As it can be seen on both time and price charts , the price has gone into demand levels on both charts. Trade is now taken ..lets see how it goes..Ignored