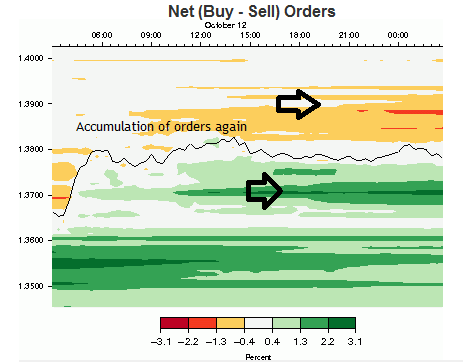
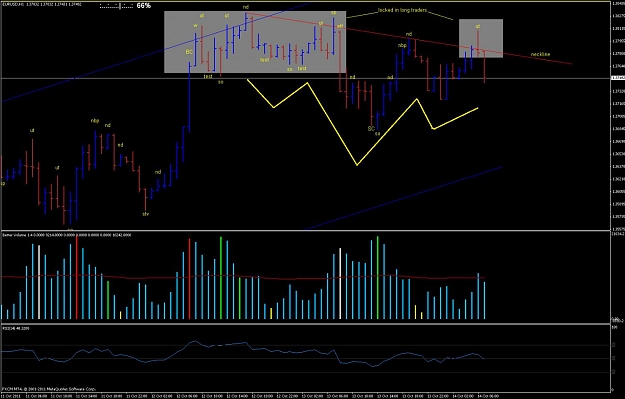
Here on this shot I would like to show visually the internal dynamics between accumulation and exaustion of orders and their relationship with the current volatility.
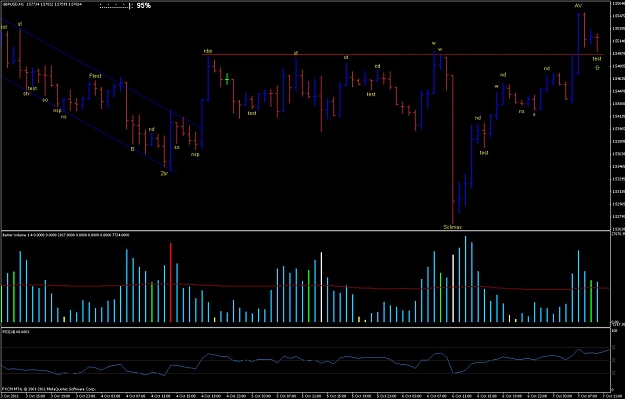
Look at the picture, the places where the price would stop and take a break are not random. As we have noticed on EUR/USD there is a very strong relationship with the round numbers and the intervals of 100 pips and 50 pips between the round numbers.
Look at the picture you could see how the pair started to drift sideways. It started doing so because the orders were exausted. Everything that could be eated was eated. You know you can look the forex market as one cell creature that has a feeling where the food is and where is the food it starts to move in that direction (the right terminology is tropism check wikipedia ). When there is no food it does not move but waits the food to come.
The volatility drops too, when we have a process of accumulation of orders. Well that is not new, every experienced trader is able to detect this range situation. However what is not visible at the naked eye is where exactly the new orders are accumulated, and that is the point of this blog post.
Whithin the group of market state analysis we see that the volatility has predictable cycles, cycles clearly visible to the naked eye even without using Goertzel (LOL). I think that one of the best uses of the neural nets in the market are not necessarily the directionnal bias but the volatility. In that situation we really can count on them as a reliable tool.
If you count on them as a tool especially on low time frame graphics we will get hurt, look at the picture there is not way to predict where the market will go first. It is highly probable if you consider it as an organism to go both ways and to eat the accumulation of orders before it moves to another point of equilibrium (it is between the lines but market makers are not bear nor bulls they eat market orders to exist).
Now as we have an accumulation of orders the market is going to hit them. When, the movement is about to begin we would need to project the next volatility explosion cycle.
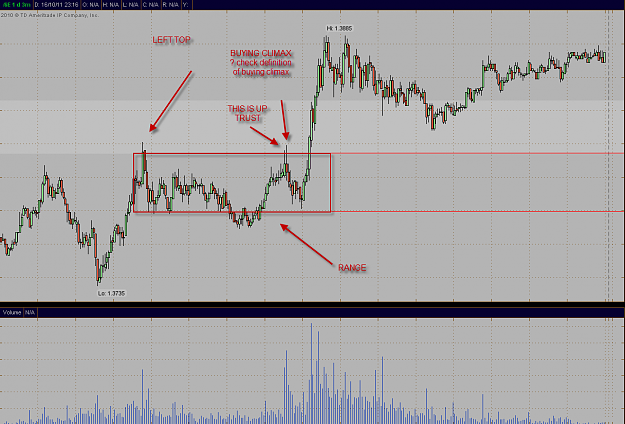
If we compare with the VSA (Volume Spread Analysis). There are two main processes. Accumulation and Distribution.
The logic of the VSA was developped for the stock market.
Orders analysis:
Accumulation: In our perspective the accumulation is when we have accumulation of market orders.
Distribution: The distribution is when those market order are transformed in real orders. When it comes at a place where there is an accumulation of open orders I could say that a distribution occurs between the retail players and market makers.
Those two processes can be monitored on the screen even if we do not have a real time feed and our picture is delayed with some hours.
Those two processes are terribly linked with the support and resistance, and mass psychology.
We have a relationship with the mass psychology because people are attracted to certain places. That is the driving force. The accumulation of orders is the tangible result. When you use Fibos you work with premisses, when you look at the market orders you see the result of the premisses.
The relationship with the support and resistance is because a distribution occurs where there is an accumulation of orders and very often that leads to a change of direction and a support and resistance is formed. With the open orders and the projected ditribution points we can see the projected support and resistance points that may coincide or not with the actual support and resistance poitns from the technical analysis perspective, if they do that means that we have another probabilistic factor in our assumption that that would be a probable support - resistance zone.
Having that picture there is not mystery about the head fake, or the fake break - out. There is nothing fake. An accumulation of orders takes place. And a distribution occurs on the both sides. The market has been effective, market makers have eaten all possible orders in that situation.
We are happy, they will give us lower spreads.
material from:
http://beathespread.com/groups/profi...th-open-orders
Look at the picture, the places where the price would stop and take a break are not random. As we have noticed on EUR/USD there is a very strong relationship with the round numbers and the intervals of 100 pips and 50 pips between the round numbers.
Look at the picture you could see how the pair started to drift sideways. It started doing so because the orders were exausted. Everything that could be eated was eated. You know you can look the forex market as one cell creature that has a feeling where the food is and where is the food it starts to move in that direction (the right terminology is tropism check wikipedia
The volatility drops too, when we have a process of accumulation of orders. Well that is not new, every experienced trader is able to detect this range situation. However what is not visible at the naked eye is where exactly the new orders are accumulated, and that is the point of this blog post.
Whithin the group of market state analysis we see that the volatility has predictable cycles, cycles clearly visible to the naked eye even without using Goertzel (LOL). I think that one of the best uses of the neural nets in the market are not necessarily the directionnal bias but the volatility. In that situation we really can count on them as a reliable tool.
If you count on them as a tool especially on low time frame graphics we will get hurt, look at the picture there is not way to predict where the market will go first. It is highly probable if you consider it as an organism to go both ways and to eat the accumulation of orders before it moves to another point of equilibrium (it is between the lines but market makers are not bear nor bulls they eat market orders to exist).
Now as we have an accumulation of orders the market is going to hit them. When, the movement is about to begin we would need to project the next volatility explosion cycle.
If we compare with the VSA (Volume Spread Analysis). There are two main processes. Accumulation and Distribution.
The logic of the VSA was developped for the stock market.
Orders analysis:
Accumulation: In our perspective the accumulation is when we have accumulation of market orders.
Distribution: The distribution is when those market order are transformed in real orders. When it comes at a place where there is an accumulation of open orders I could say that a distribution occurs between the retail players and market makers.
Those two processes can be monitored on the screen even if we do not have a real time feed and our picture is delayed with some hours.
Those two processes are terribly linked with the support and resistance, and mass psychology.
We have a relationship with the mass psychology because people are attracted to certain places. That is the driving force. The accumulation of orders is the tangible result. When you use Fibos you work with premisses, when you look at the market orders you see the result of the premisses.
The relationship with the support and resistance is because a distribution occurs where there is an accumulation of orders and very often that leads to a change of direction and a support and resistance is formed. With the open orders and the projected ditribution points we can see the projected support and resistance points that may coincide or not with the actual support and resistance poitns from the technical analysis perspective, if they do that means that we have another probabilistic factor in our assumption that that would be a probable support - resistance zone.
Having that picture there is not mystery about the head fake, or the fake break - out. There is nothing fake. An accumulation of orders takes place. And a distribution occurs on the both sides. The market has been effective, market makers have eaten all possible orders in that situation.
We are happy, they will give us lower spreads.
material from:
http://beathespread.com/groups/profi...th-open-orders
Attached Image