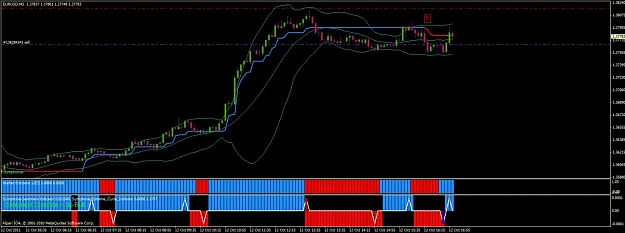
Most of you probably already know this, but in case anyone is struggling to see the colour of the trendline when it's covered by a candle... try switching to a bar chart or hold your mouse over the line and a value will pop-up. Value1 means it's blue (long) and Value2 means red (short).
PB
PB