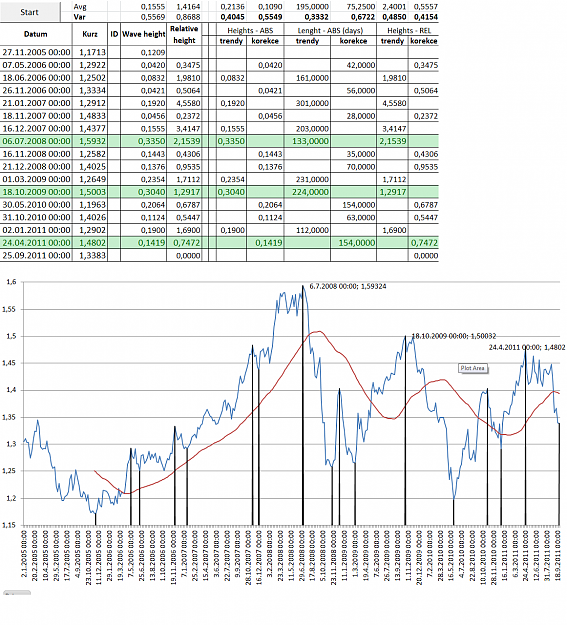
DislikedPurpose of the system
Now to the system. I mainly focus on examining Elliot waves, statisics included refer to them . While refering to the spot we chose for peak/low of a wave, I use a term breakpoint, as I dont care whether it is up or down because of nature of exchange rate. As a main weakness of Elliot waves, I consider their unability to predict height of current correction/trend. For determining height of the current wave, traders can use fibo numbers, pivot points, S/R and consider oscillators. In a short term range, any of these...Ignored
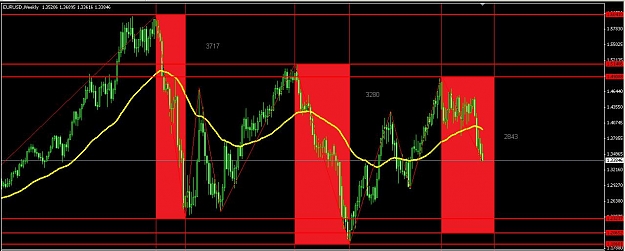
Though I do not work with the Elliot waves, taking a comparison of market movement has given me a range of expected play to a very close area that you called support.
Working on the yearly swings on a weekly chart, taking the spike high of 2008 to the swing low, we get an area of movement of approx 3717 pips off the drop. Taking the following yearly swings, spike high of 2009 ended in a swing low of 2010, giving a market range of approx 3280, and the difference of the 2 years of about 437 pips.
Now, if we adjust the strength of the weakening down trend chan, and shoot for market symmetry we could take an assumption that pulling the difference of the 2 years from the last year and using that as a swing low forecast, it would look something like this.
3280-437=2843.
From there, assumption of swing 2843 from spike high 2011, May 1, 1.49808ish, and would give us a bottom side support on a weakening waves down to 1.2065...
Am I pickin up whut yer puttin down?
Attached Image (click to enlarge)
Money Can't Buy Happiness. Poverty Can't Buy SHIT! You Choose!