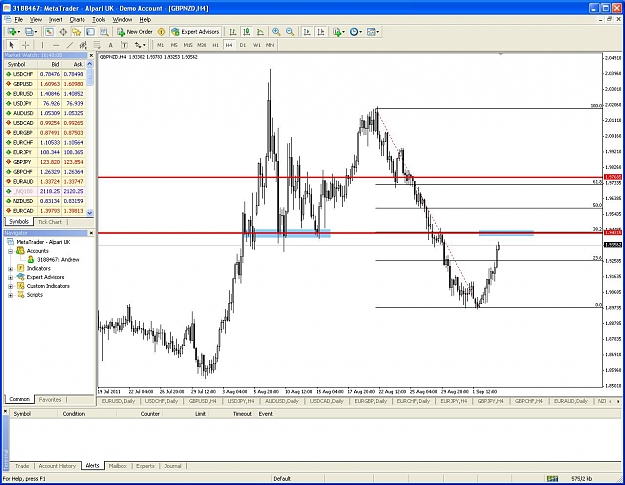
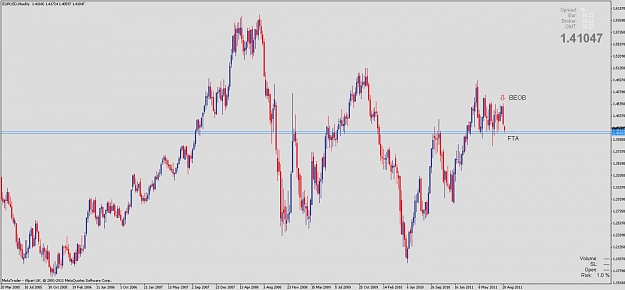
DislikedWhat is the name for the formation outlined? I am watching the 1.4150 area for some PA based on the triangle formation thingy & it seems to be an area of support & it also happens to be the 25% Fibo Ret of the upmove since June of last year & the 38% Fibo Ret of the upmove that began in January of this year. Is this how the "seasoned" traders do it? (By having everything marked out on the chart beforehand, that way they know what areas to watch.) Any advice/pointers?
http://i236.photobucket.com/albums/f...eurusd9411.jpg...Ignored
Right Click on the Chart & "Save as Picture"
Make a note of where you Save it to & then using the Attachments (paperclip) on the Toolbar of a New Post, add it to your Post.
B